Pasta is the awkward case in carbohydrate advice. It's a refined white-flour food, and on the glycaemic index it scores like beans and lentils more than like white bread. So some people with diabetes avoid it altogether, while others have read that cooking it al dente, or chilling and reheating it, turns it into something else.
We went back to what the glucose tests measured. One popular claim turned out weaker than expected, another holds up but in a smaller way than it's sold, and the biggest effect is one nobody finds very exciting. The article on potatoes and blood sugar and our rice piece ask the same questions of those starches.
What the glycaemic index tests found
GI compares the blood sugar rise from a fixed amount of carbohydrate with the rise from the same amount of glucose, set at 100. In the most thorough survey so far, Di Pede and colleagues (Foods, 2021) gathered 95 pasta products tested under the international (ISO) method:
| Pasta type | Products tested | Mean GI |
|---|---|---|
| Other added ingredients (protein, fibre, resistant starch) | 5 | 37 |
| Containing legumes | 9 | 46 |
| Whole wheat | 6 | 52 |
| Containing egg | 5 | 52 |
| 100% refined wheat | 35 | 55 |
| Noodles and vermicelli | 9 | 56 |
| Gluten-free | 11 | 60 |
A GI of 55 or under counts as low, so ordinary refined pasta sits right at the top edge. The range matters as much as the mean, though. Refined wheat products ran from about 33 to 84, so any single figure on a website is an estimate. White spaghetti in the 2021 international tables averages about 47, and white bread about 73. A systematic review with meta-analysis (Huang, 2017) found that pasta meals give a lower glucose response than bread or potato meals.
Note too that gluten-free isn't lower. It's higher on average, and one brown rice pasta in the older tables scored 92. That's useful for anyone who assumes gluten-free means gentler on blood sugar.
Al dente: a tidy table, and shakier tests
The claim comes largely from a neat pattern in the international GI tables (Foster-Powell, 2002):
| White spaghetti, boiled for | Mean GI | Studies |
|---|---|---|
| 5 minutes | 38 | 4 |
| 10 to 15 minutes | 44 | 7 |
| 20 minutes | 61 | 2 |
It looks like a clean rule. But those rows pool different pastas tested in different countries, and the 20-minute row is two studies. Inside the table itself, the 5-minute row runs from 32 to 44 and the 10 to 15 minute row from 32 to 58. One Canadian brand scored 32 at 5 minutes and 32 and 36 at 15.
When one lab gave the same pasta at different cooking times to the same people, the gap largely disappeared:
| Study | People | Compared | Result |
|---|---|---|---|
| Wolever, Diabetes Care 1986 | 13 people with diabetes | Spaghetti boiled 5 or 15 minutes | GI 45 and 46, not significantly different |
| Bornet, Am J Clin Nutr 1990 | 12 healthy adults | Pasta boiled 11, 16.5 or 22 minutes (50 g starch) | No significant difference in glucose or insulin |
Both are old and small. It's quite plausible that very soft pasta digests faster, and Di Pede's review says cooking time does affect how available the carbohydrate is. We also found no modern large trial comparing the two. But the claim that al dente pasta has a much lower GI than pasta cooked to the packet time isn't what head-to-head tests show. Cook it to firm because it tastes better and may help slightly. Don't count on it to fix a large portion.
Cooled and reheated: real, but varied
Cooked starch that's chilled partly re-forms into a tighter structure called resistant starch, which the small intestine can't fully digest. Here's what the pasta trials found. Where the papers give a time, the pasta was chilled overnight or for 24 hours.
| Study | People | Meal | Result, fresh against chilled and reheated |
|---|---|---|---|
| Hodges, Foods 2019 | 45 adults aged 20 to 24 | 100 g dry fusilli with tomato sauce | Area under the curve 735 against 703, 4% lower (significant). Peak 7.10 against 6.94 mmol/L. Eaten cold rather than reheated: 722, not significant |
| Robertson, Eur J Clin Nutr 2021 | 10 healthy adults | Pasta, olive oil and tomato sauce | Significant overall (p = 0.006), largest gap with chilled-and-reheated. An earlier abstract from the group reported 41% less incremental area |
| Alhussain, Prog Nutr 2022 | 8 healthy young men | Matched meals | No significant difference in glucose or insulin, though they felt fuller |
| Rogowicz-Frontczak, Nutrients 2026 | 32 adults with type 1 diabetes on insulin pumps | 50 g carbohydrate, about 5.3 units of insulin in both | Peak 12.6 against 10.7 mmol/L; rise 4.7 against 2.8; incremental area 525 against 212. Low blood sugar: 1 person against 2 |
Those results look far apart partly because they measure different things. Total area under the curve includes your fasting glucose, so 4% of it isn't the same as 4% of the rise. Sizes range from nothing to a big effect, in small trials. The type 1 result is the largest and the most interesting, and it's also an exploratory study with no sample size calculation and no correction for many comparisons, in people with insulin on board.
That study also measured the starch: resistant starch went from 8.03 to 12.88 g per 100 g, a gain of about 4.9 g per 100 g. The paper doesn't say whether that's per 100 g of dry or cooked pasta, so on its 100 g dry portion, the gain is roughly 5 to 10 g. That's useful, and it's still far from all the carbohydrate on the plate.
If you want to try it: cook, cool quickly, refrigerate within two hours, keep it covered, and eat it within 3 to 4 days. Reheat until steaming all the way through. Pasta salad counts as the cold version. If you take insulin: the study authors didn't recommend changing doses, and the lows didn't differ, but the fresh pasta peaked at about 125 minutes and the cooled pasta at about 65. Review your own readings with your diabetes team before changing anything.
The portion is the big number
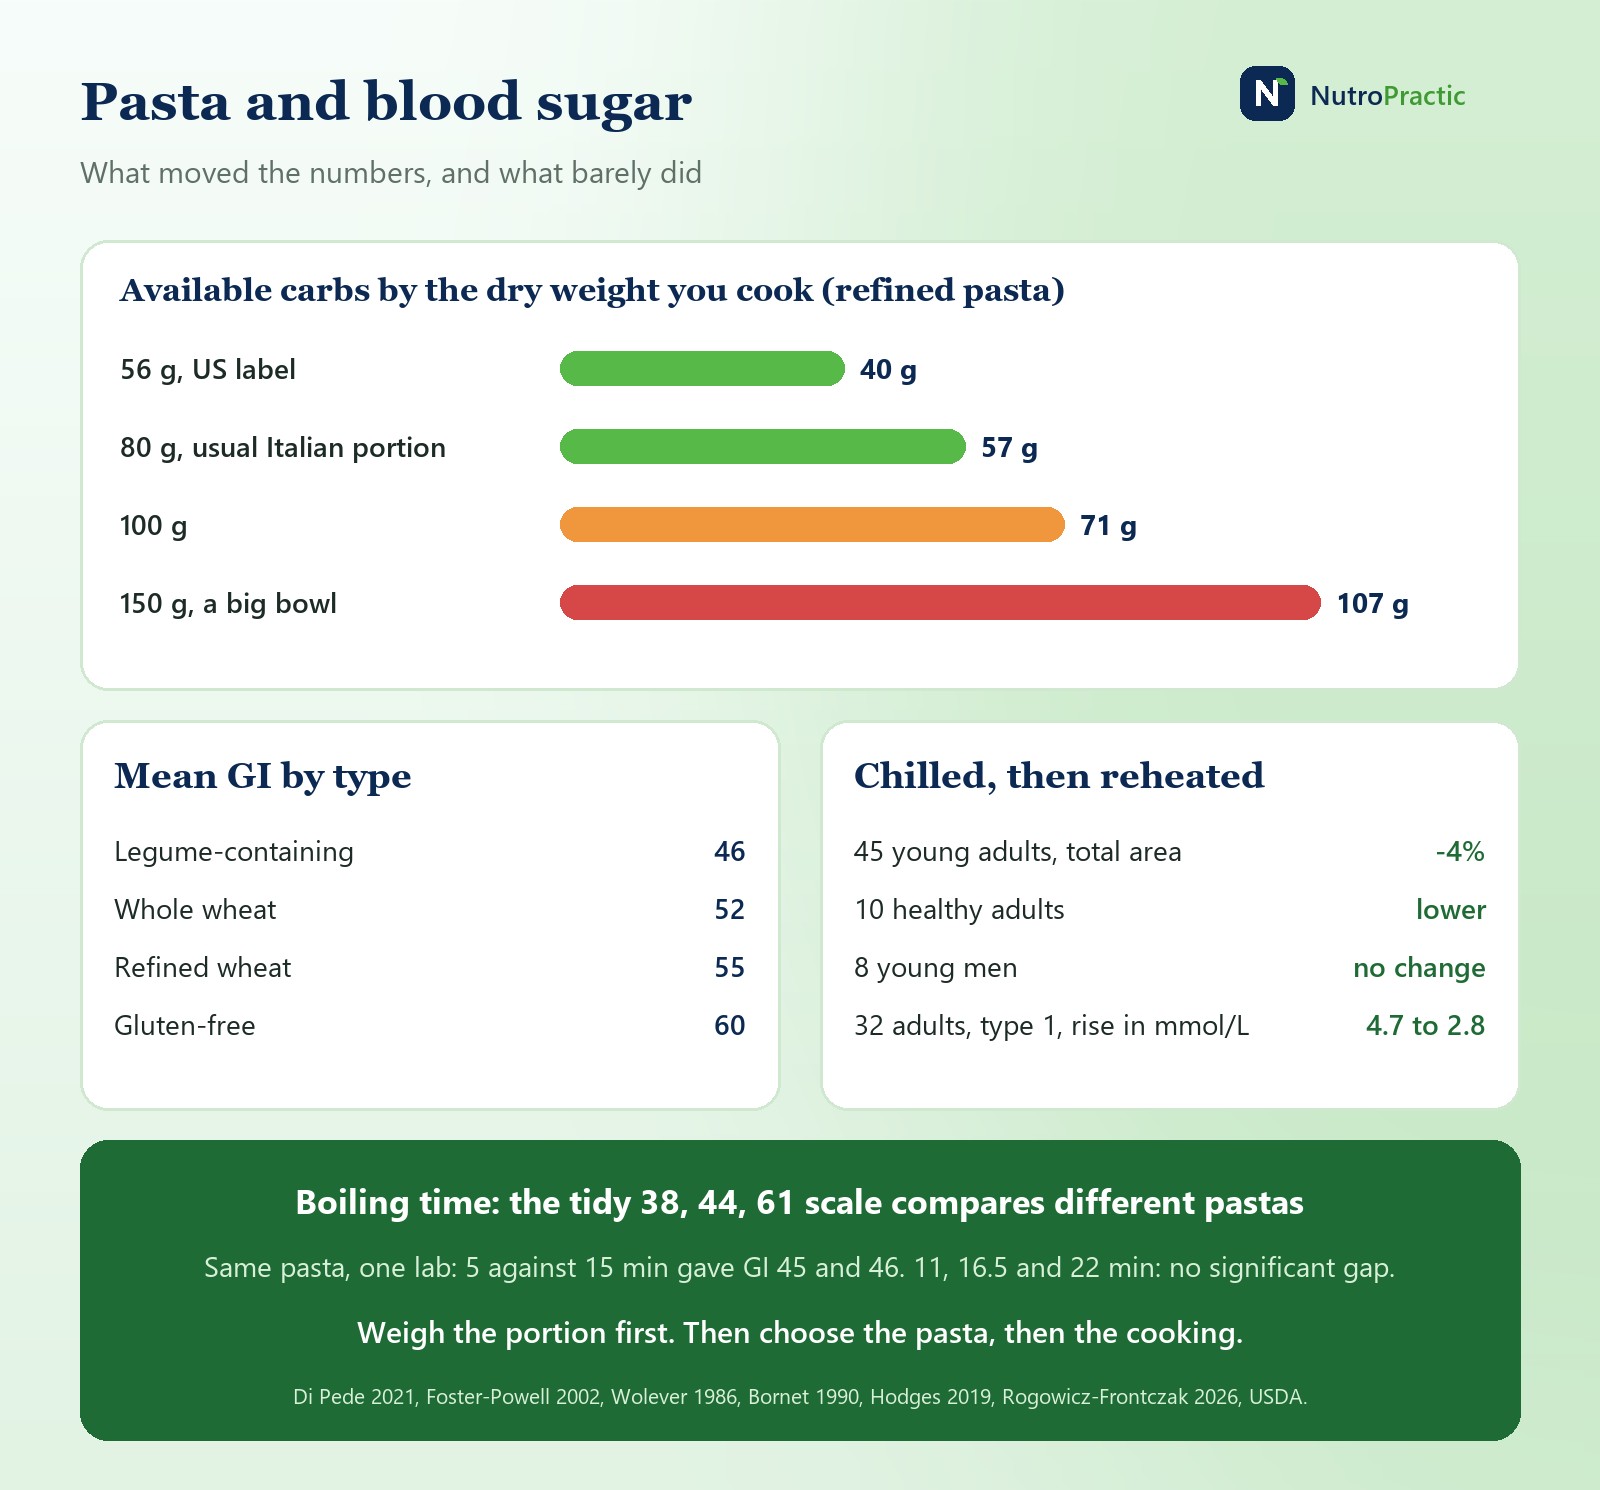
GI is measured per fixed amount of carbohydrate, and that makes it blind to how much you ate. Glycaemic load is the simple correction: GI times the grams of available carbohydrate, divided by 100. Using USDA's figure of about 71.5 g of available carbohydrate per 100 g of dry pasta, and a GI of 55:
| Dry weight | Cooked weight | Available carbs | Glycaemic load |
|---|---|---|---|
| 56 g: US label serving (2 oz) | about 140 g | 40 g | 22 |
| 80 g: usual Italian portion | about 200 g | 57 g | 31 |
| 100 g: the dry portion in two of the trials above | about 240 g | 71 g | 39 |
| 125 g: a generous home bowl | about 300 g | 89 g | 49 |
| 150 g: a big bowl | about 370 g | 107 g | 59 |
Going from 80 g to 150 g adds 50 g of carbohydrate and nearly doubles the load. Nothing in the cooking sections does that. It's also where restaurants come in. We couldn't find a good survey of dry weight in restaurant servings, but the portion effect itself is well measured. In a cafeteria study (Diliberti, Obesity Research 2004), a pasta entrée sold at 248 g or 377 g: people who bought the larger one ate 43% more of it, about 172 kcal extra, and 25% more over the whole meal. Our guide to serving sizes shows why pack servings rarely match the bowl.
Weigh your dry pasta once. Most people are surprised, and after one look at 80 g you can usually judge it by eye. When eating out, it's reasonable to order a starter portion or eat half and box the rest.
Whole-wheat and legume pastas, per 100 g
Figures are for dry pasta, from USDA records of the US labels. US labels include fibre in total carbohydrate, so we subtract it to get available carbohydrate; European labels already list carbohydrate without fibre, so don't subtract on those. These figures are scaled up from rounded 56 g label servings, so treat small gaps as noise, and individual legume products weren't each GI-tested. The GI column is the category mean from Di Pede.
| Pasta, per 100 g dry | kcal | Protein | Total carbs | Fibre | Available carbs | Category mean GI |
|---|---|---|---|---|---|---|
| Refined pasta, USDA | 371 | 13 g | 74.7 g | 3.2 g | 71.5 g | 55 (35 products) |
| Whole-wheat pasta, USDA | 352 | 13.9 g | 73.4 g | 9.2 g | 64.2 g | 52 (6 products) |
| Barilla Red Lentil Spaghetti | 321 | 23.2 g | 60.7 g | 10.7 g | 50.0 g | 46 (9 legume products) |
| Barilla Chickpea Casarecce | 339 | 19.6 g | 60.7 g | 14.3 g | 46.4 g | 46 (legume) |
| Banza Chickpea Pasta | 333 | 24.6 g | 56.1 g | 14 g | 42.1 g | 46 (legume) |
And for the same 80 g on your plate:
| Pasta, 80 g dry | Available carbs | Fibre | Protein | Glycaemic load |
|---|---|---|---|---|
| Refined pasta, USDA | 57 g | 2.6 g | 10 g | 31 |
| Whole-wheat pasta, USDA | 51 g | 7.4 g | 11 g | 27 |
| Barilla Red Lentil Spaghetti | 40 g | 8.6 g | 19 g | 18 |
| Barilla Chickpea Casarecce | 37 g | 11.4 g | 16 g | 17 |
| Banza Chickpea Pasta | 34 g | 11.2 g | 20 g | 15 |
So 80 g of chickpea or red lentil pasta has about a third fewer available carbs and roughly twice the protein of refined pasta, with three to four times the fibre. Whole wheat is a smaller step on carbs and GI, but nearly triples the fibre, and that's useful in its own right since most adults fall short. These figures don't mean legume pasta is carb-free: 34 to 40 g in 80 g is still a meaningful amount. Add fibre gradually, because a sudden 11 g in one bowl can cause wind and bloating.
Pasta over the long term
| Study | People | Finding | Worth knowing |
|---|---|---|---|
| Pounis, Nutr Diabetes 2016 | 14,402 (Moli-sani) and 8,964 (INHES), Italy | More pasta went with lower BMI and waist-to-hip ratio after adjustment | Cross-sectional. Results were weaker when corrected for total calories, and clear only in Moli-sani women. INHES was funded by Barilla |
| Huang, BMJ Nutr Prev Health 2021 | 84,555 US postmenopausal women | Highest against lowest quarter: diabetes HR 1.02 (0.96 to 1.07), cardiovascular disease 0.89, stroke 0.84 | Observational. Swapping white bread or fried potato for pasta was linked to lower stroke risk |
| Vitale, Nutrients 2019 (TOSCA.IT) | 2,562 Italians with type 2 diabetes | More pasta: no difference in glucose control or weight, and lower HDL cholesterol | Cross-sectional, with total carbs within recommended limits |
| Chiavaroli, BMJ Open 2018 | 32 trial comparisons, 2,448 adults | Low-GI diets including pasta: 0.63 kg less body weight than higher-GI diets | No trial tested pasta alone. Some authors had support from Barilla |
Our reading: there's no sign that pasta at normal Italian amounts drives weight gain or diabetes. Moli-sani's average intake was about 57 g a day for women and 75 g for men, which is a good deal less than a nightly restaurant bowl. There's also no solid proof it protects you. People who eat pasta in these studies also tend to eat differently, and at least two of the four carry an industry link. Huang's 2017 review made the same point: the long-term evidence on pasta and disease is thin.
A pasta plate for diabetes, step by step
1. Weigh 80 g dry (or less, if your care plan sets a smaller carb target). 2. Pick the pasta: legume or whole wheat when you like it; ordinary pasta is fine at that portion. 3. Fill half the plate with vegetables, in the sauce or on the side. 4. Add protein: fish, chicken, beans or lentils. 5. Use a little olive oil and watch sweet jarred sauces. 6. Cook to firm, not soft, and use leftovers chilled and reheated if it's convenient. 7. Test it. If you use a meter, check before eating and two hours after with the same meal on two different days, changing one thing at a time. A sensor shows you the whole curve, which matters because rich sauces can delay a rise past the two-hour mark.
The American Diabetes Association's usual target for most non-pregnant adults is under 180 mg/dL (10 mmol/L) one to two hours after starting a meal, though your team may set something different. If you're on insulin or a sulfonylurea, don't change doses from this article, and tell your team if you try a new pasta.
Weigh the pasta first. Choose the pasta second. Worry about the boiling time last.
Want pasta to fit your own glucose readings rather than a general rule? Dr. Triveni can build a meal plan around the food you enjoy in a virtual consultation.
Book a consultationThis article is general information, not medical advice. If you have diabetes, especially if you use insulin or sulfonylureas, talk to your doctor or diabetes team before changing your meals or medicines. Brands are named only as label examples; we have no link to them.
Sources
GI: Di Pede G. et al., Glycemic index values of pasta products: an overview, Foods 10(11):2541 (2021). Foster-Powell K. et al., International table of glycemic index and glycemic load values: 2002, Am J Clin Nutr 76:5-56, read from a reprint of the pasta table. Atkinson F.S. et al., International tables of glycemic index and glycemic load values 2021, Am J Clin Nutr 114:1625-1632; the 47 and 73 averages are as reported by a secondary listing. Wolever T.M. et al., Glycemic response to pasta, Diabetes Care 9:401-404 (1986). Bornet F.R. et al., Pasta cooking time, Am J Clin Nutr 51:421-427 (1990). Huang M. et al., A systematic review on the relations between pasta consumption and cardio-metabolic risk factors, Nutr Metab Cardiovasc Dis (2017).
Cooling: Hodges C. et al., Method of food preparation influences blood glucose response to a high-carbohydrate meal, Foods 9(1):23 (2019). Robertson T.M. et al., The cumulative effects of chilling and reheating a carbohydrate-based pasta meal, Eur J Clin Nutr (2021), and the group's 2018 abstract. Alhussain M.H. et al., Influence of chilling-and-reheating pasta on postprandial glycemic responses and appetite, Prog Nutr 24(4) (2022). Rogowicz-Frontczak A. et al., Does resistant starch formed by cooling pasta decrease the postprandial glycemic response in type 1 diabetes?, Nutrients 18(7):1152 (2026).
Long term and portions: Pounis G. et al., Association of pasta consumption with body mass index and waist-to-hip ratio, Nutr Diabetes 6:e218 (2016). Huang M. et al., Pasta meal intake in relation to risks of type 2 diabetes and atherosclerotic cardiovascular disease, BMJ Nutr Prev Health (2021). Vitale M. et al., Pasta consumption and connected dietary habits: TOSCA.IT, Nutrients 12(1):101 (2019). Chiavaroli L. et al., Effect of pasta in the context of low-glycaemic index dietary patterns on body weight, BMJ Open 8:e019438 (2018). Diliberti N. et al., Increased portion size leads to increased energy intake in a restaurant meal, Obes Res 12:562-568 (2004). American Diabetes Association, Standards of Care in Diabetes. Italian portion of 80 to 100 g: La Famiglia, a restaurant guide rather than a study.
Food data, read 4 November 2026: USDA FoodData Central records 168927 pasta, dry, 169738 whole-wheat pasta, dry, 2598846 Barilla Red Lentil Spaghetti, 2570680 Barilla Chickpea Casarecce, 2669987 Banza Chickpea Pasta.