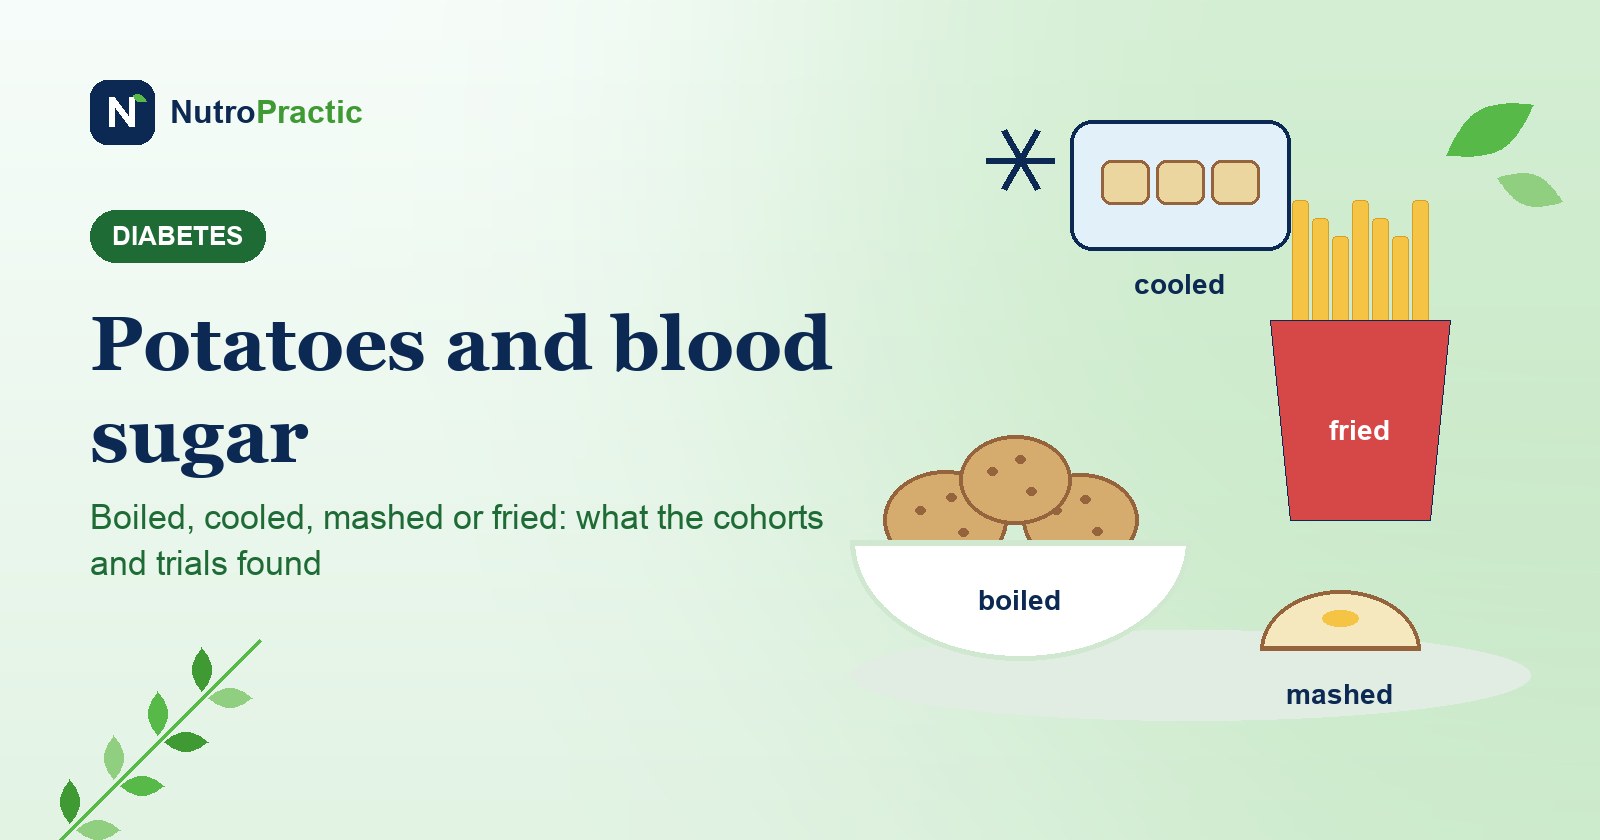
Potatoes have a bad name with anyone watching their blood sugar. The glycaemic index tables put a hot boiled potato up with white bread, and diabetes diet sheets often list them next to sweets. Yet whole countries eat potatoes every day, and the largest studies don't treat all potatoes the same. A plain boiled potato and a portion of fries turn out to be very different foods, and so do a hot potato and the same potato eaten cold the next day.
Here is what the cohorts of more than 200,000 people, the glycaemic index tests and the small cooling trials actually found, with the numbers per portion.
Fries versus boiled: what the big cohorts found
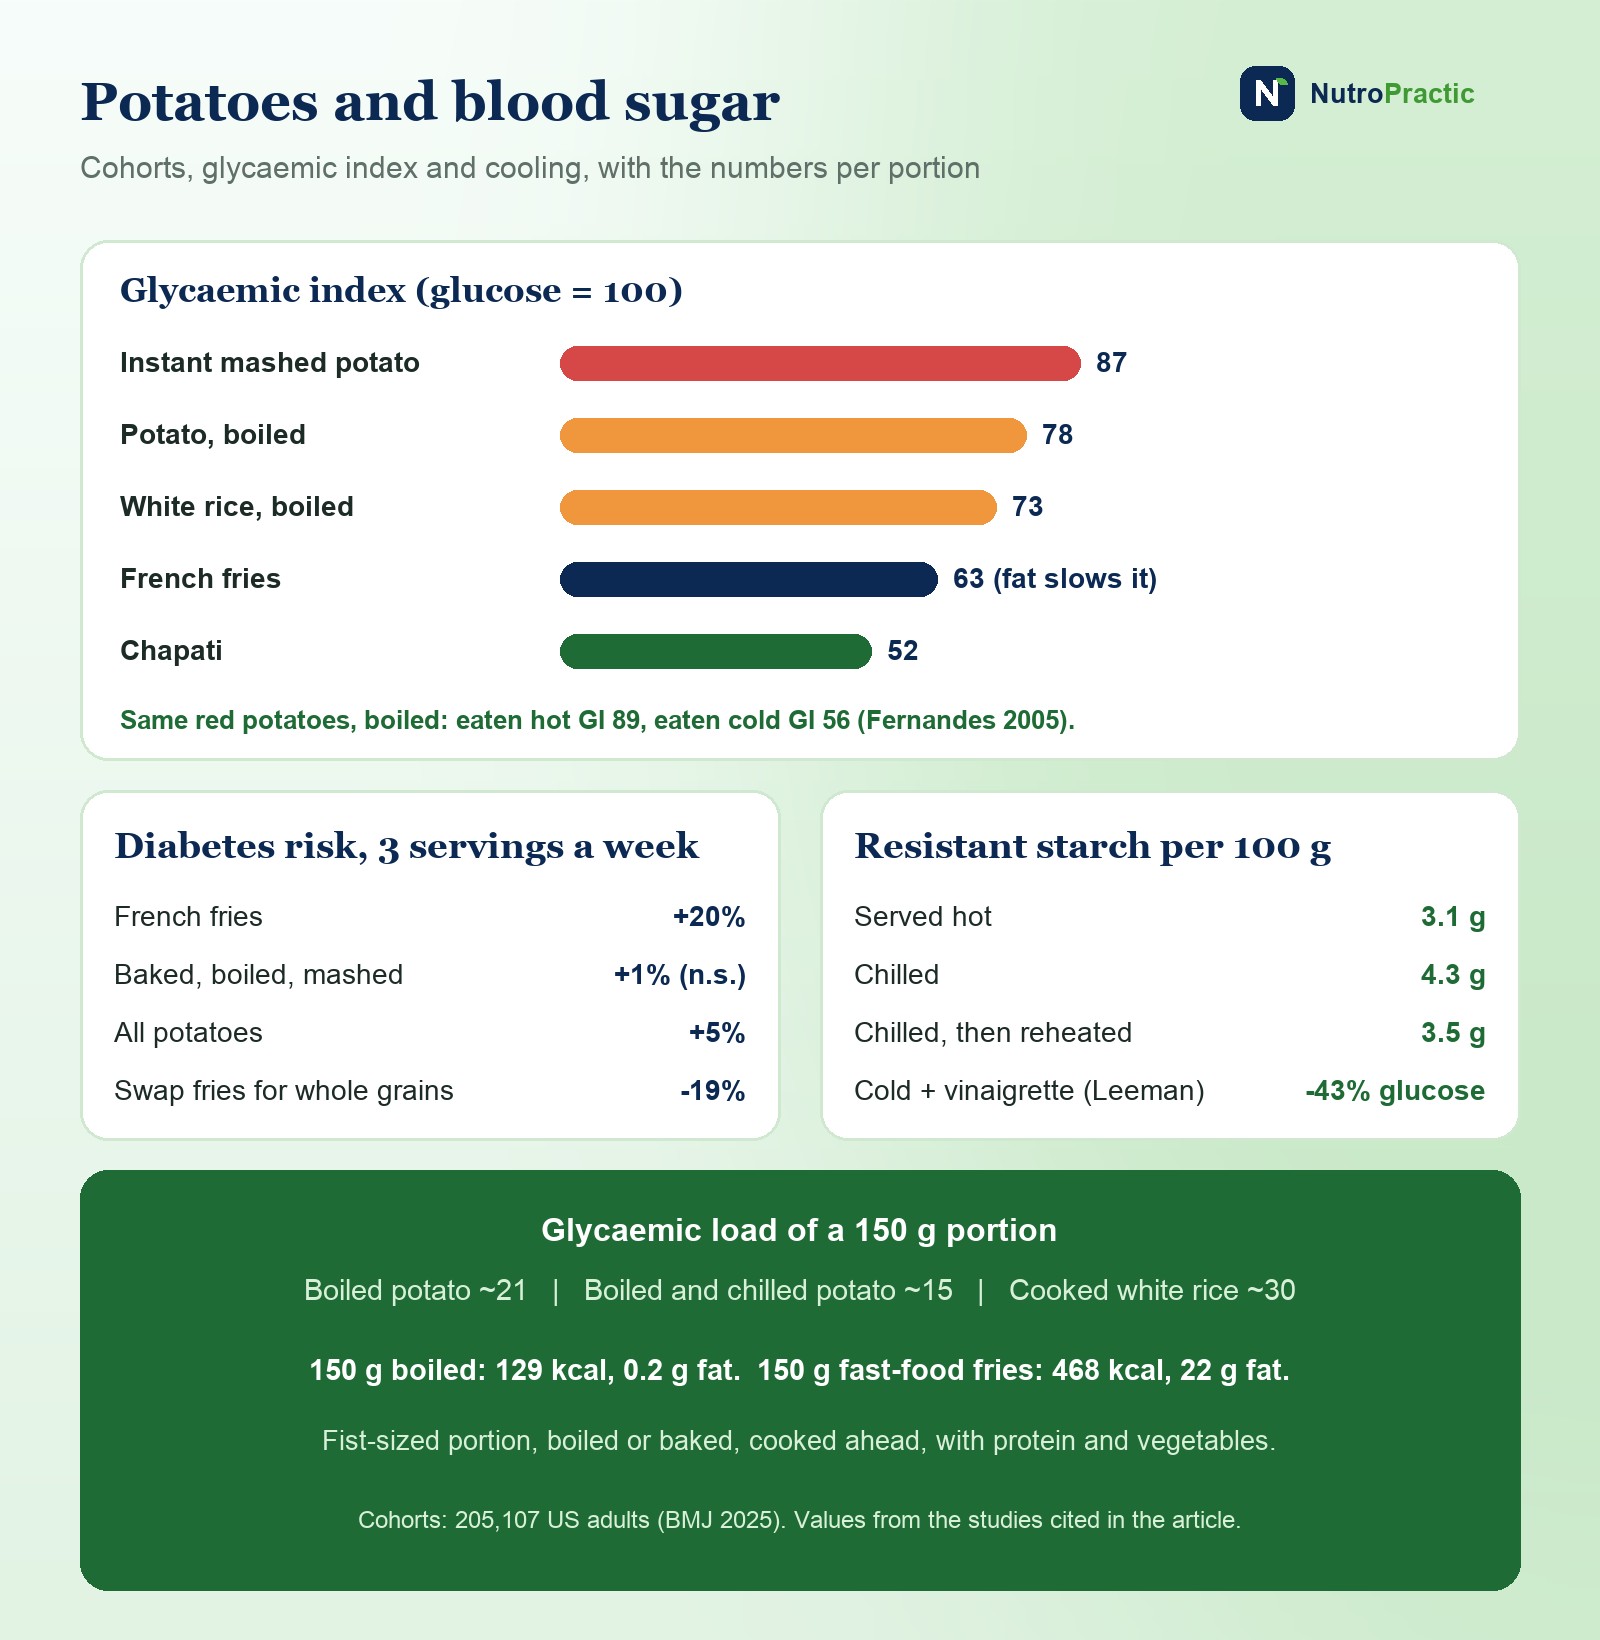
The most detailed data come from three long-running Harvard cohorts of US nurses and health professionals. In the latest analysis (Mousavi and colleagues, BMJ, August 2025), 205,107 people were followed for decades (over 5 million person-years), and 22,299 developed type 2 diabetes. Per extra 3 servings a week:
French fries: 20% higher risk (hazard ratio 1.20, 95% CI 1.12-1.28)
Baked, boiled or mashed potatoes: 1% higher, not statistically different from no change (1.01, 0.98-1.05)
All potatoes together: 5% higher (1.05)
The same paper pooled 13 cohorts from around the world (587,081 people): fried potatoes were linked to 16% higher risk per 3 servings a week, and potatoes overall to 3%. An earlier analysis of the same Harvard cohorts (Muraki and colleagues, Diabetes Care 2016) found that people eating potatoes 7 or more times a week had 33% higher risk than those eating them less than once a week, again driven mostly by fries.
In Denmark (Pokharel and colleagues, Diabetes Care 2023; 54,793 adults over 16 years), the highest potato eaters (a median of 256 g a day) had 9% higher risk than the lowest (52 g a day). Once the rest of the diet was taken into account, the link was no longer clear (1.04, 0.98-1.12). After adjustment, boiled potatoes showed no link (1.03) and fries and chips had the highest figure (1.08), though not statistically clear. The same study found that people eating the most vegetables (not counting potatoes) had 21% lower risk.
These are observational studies, so they show who got diabetes, not why. People who eat a lot of fries also tend to eat more burgers and drink more soft drinks. But the gap between fried and boiled potatoes is consistent across countries.
What the potato is replaced with matters
The BMJ paper asked what happens, statistically, when 3 weekly servings of potatoes are swapped for something else. Swapping fries for whole grains was linked to 19% lower risk; swapping baked, boiled or mashed potatoes for whole grains, to 4% lower. Swapping potatoes for white rice was not linked to lower risk; the authors found it went the other way. In other words, plain boiled potatoes are roughly in the same place as other refined starches, and the real gains come from whole grains, beans and lentils.
Glycaemic index by cooking method
The glycaemic index (GI) compares how far a food's carbohydrate raises blood sugar against pure glucose (100). Potatoes vary a lot. From the international GI tables (Atkinson and colleagues, Diabetes Care 2008), on the glucose scale:
Instant mashed potato: 87
Potato, boiled: 78
White bread: 75
White rice, boiled: 73
French fries: 63
Sweet potato, boiled: 63
Potato crisps: 56
Chapati: 52
Fries and crisps score lower than boiled potatoes only because their fat slows stomach emptying. A lower GI does not make them better for blood sugar over the years; the cohort data above say the opposite, and a portion carries several times the calories.
Variety and temperature matter as much as the method. In a Canadian test of potatoes commonly eaten in North America (Fernandes and colleagues, 2005), red potatoes boiled and eaten hot scored 89, while the same potatoes boiled, refrigerated and eaten cold scored 56: about 37% lower. Baked russets scored 77 and instant mash 88. An Australian test of seven varieties (Ek and colleagues, 2014) found GIs ranging from 53 to 103, which is how a low-GI variety (Carisma) came to be sold, though most supermarket potatoes are not labelled by GI.
A worked portion: glycaemic load
GI says nothing about the portion. Glycaemic load (GL) does: GI × grams of available carbohydrate ÷ 100. Using USDA values:
150 g boiled potato (about one medium, peeled): 20.0 g carbohydrate minus 1.8 g fibre per 100 g = 27.3 g available carbohydrate. GL = 78 × 27.3 ÷ 100 = about 21.
150 g cooked white rice (about a cup): 28.2 g minus 0.4 g fibre per 100 g = 41.7 g. GL = 73 × 41.7 ÷ 100 = about 30.
Same 150 g of potato, boiled and chilled (GI 56 in the Fernandes test): 56 × 27.3 ÷ 100 = about 15.
Gram for gram, boiled potato carries about a third less carbohydrate than cooked rice (20 g against 28 g per 100 g), because it holds more water. A medium potato in place of a cup of rice is a smaller glucose load, not a bigger one.
Cooling: resistant starch, in grams
When cooked potato cools, some of its starch packs back into a tight structure (retrogradation) that the small intestine can't fully digest. That part, resistant starch, passes on to the gut bacteria like fibre.
A USDA team (Raatz and colleagues, Food Chemistry 2016) measured three common varieties, baked or boiled, served hot, chilled or reheated. Variety made no difference; temperature and method did. The averages the authors released:
Served hot: 3.1 g resistant starch per 100 g
Chilled (4 °C): 4.3 g per 100 g
Chilled, then reheated: 3.5 g per 100 g
Baked (all temperatures): 3.6 g; boiled: 2.4 g
So chilling adds roughly 1 to 1.5 g of resistant starch per 100 g, and reheating keeps part of the gain. On a 150 g portion that is about 2 g extra, a modest amount next to the 25-30 g of fibre a day adults are advised to eat, but it comes with a lower glucose rise.
What the cooling trials measured
Leeman and colleagues (European Journal of Clinical Nutrition, 2005) fed 13 healthy adults freshly boiled potatoes or potatoes stored cold and served with a vinaigrette. The cold potato salad gave a 43% lower glucose response and 31% lower insulin response. Cold storage alone cut the insulin response by 28%; the vinegar added the rest.
In 30 women with raised fasting glucose and insulin (Patterson and colleagues, Nutrients 2019), 250 g of chilled baked potato against the same amount freshly boiled gave 17.7% lower insulin and slightly lower glucose at 15 and 30 minutes, but the total glucose response over the test was not significantly different.
In 24 adults with type 2 diabetes (Devlin and colleagues, Clinical Nutrition 2021), an evening meal built on skinless boiled, roasted, or boiled-and-cooled potato gave lower overnight glucose than the same meal built on basmati rice. Both of these last two trials were funded by the potato industry's research body, which is worth knowing, though the results fit the GI data.
The honest summary: cooling reliably lowers the insulin response and usually trims the glucose peak. It does not turn a potato into a vegetable. Portion and what is on the plate with it still do more.
Doing it safely
Cool cooked potatoes within two hours, keep them covered in the fridge and eat them within 3 to 4 days. Reheat until steaming hot all the way through. The same rule applies to rice; see our rice article, where chilled-and-reheated rice gave an 18% lower glucose response.
Calories and fat: where fries really differ
Per 150 g, USDA FoodData Central gives:
Boiled, peeled: 129 kcal, 0.2 g fat, 492 mg potassium, 11 mg vitamin C
Baked with skin: 140 kcal, 0.2 g fat, 803 mg potassium, 14 mg vitamin C
Oven-baked frozen fries: 291 kcal, 10 g fat
Fast-food fries: 468 kcal, 22 g fat, 315 mg sodium
Frying soaks up oil and more than triples the calories of the same weight of potato. Fried potatoes are also the biggest dietary source of acrylamide, a compound formed when starchy food browns at high heat; the EU sets a benchmark of 500 µg per kg for fries. Golden rather than dark brown, and boiled or steamed more often than fried, keeps it lower.
Potatoes have real nutrients too. A baked potato with its skin has more potassium than a banana (about 800 mg against 420 mg), useful for blood pressure, which our salt and potassium article covers.
Aloo in an Indian meal
India now eats far more potato than it used to: a 2019 review in Potato Research put availability at about 24 kg per person a year in 2013, up from 3.5 kg in 1962, from over 70 kg in West Bengal to under 1 kg in Tamil Nadu. We found no human GI tests for Indian potato dishes, so the advice comes from the principles above.
The catch in many Indian meals is that aloo is cooked as the vegetable but counts as a starch. Aloo sabzi with three rotis and rice puts three starches on one plate. A few changes that follow the evidence:
Count aloo as part of the starch. If there's aloo gobi or aloo matar, have one roti less or half the rice, and add a second non-starchy sabzi or a bowl of dal.
Mix it with vegetables. Aloo with beans, cauliflower, peas or methi lowers the potato per plate; aim for potato as a third or less of the dish.
Boil, then temper. Boiled potato finished with a small tadka uses far less oil than aloo fry or deep-fried tikki and samosa.
Leftover boiled potato works. Chilled boiled potato in a chaat, raita or salad the next day, with lemon juice, gets the cooling and acid effects of the trials.
Aloo paratha: potato inside wheat plus ghee on top is a large carbohydrate and fat load. Make it smaller, use less filling with added peas or paneer, and eat it with curd and a salad rather than with pickle and butter.
Our Rice, roti and blood sugar article shows how the ICMR-NIN guidelines split the plate.
Putting it together
Prefer boiled, steamed or baked over fried, and keep fries to an occasional side, not a weekly habit.
Keep the portion to about a fist (150 g) and let vegetables fill half the plate.
Cook ahead and eat cold or reheated: potato salad with a vinegar dressing, or yesterday's boiled potatoes warmed through.
Eat the skin of baked and boiled potatoes for the extra fibre and potassium.
Add protein and fibre to the meal: fish, eggs, beans, dal or yogurt alongside.
Swap some potato meals for whole grains or pulses, which is where the cohorts saw the biggest drop in risk.
The potato is not the problem. The fryer, the portion and the three other starches on the plate usually are.
Living with type 2 diabetes or prediabetes and want to keep the foods you like, potatoes included? Dr. Triveni can build a meal plan around your plate and your glucose readings in a virtual consultation.
Book a consultationThis article is general information, not medical advice. If you take insulin or other medicines that lower blood sugar, talk to your doctor or dietitian before changing your carbohydrate intake.
Sources
Mousavi S.M. et al., Total and specific potato intake and risk of type 2 diabetes: results from three US cohort studies and a substitution meta-analysis of prospective cohorts, BMJ 390:e082121 (2025). Muraki I. et al., Potato consumption and risk of type 2 diabetes: results from three prospective cohort studies, Diabetes Care 39(3):376-384 (2016). Pokharel P. et al., Vegetable, but not potato, intake is associated with a lower risk of type 2 diabetes in the Danish Diet, Cancer and Health cohort, Diabetes Care 46(2):286-296 (2023). Schwingshackl L. et al., Potatoes and risk of chronic disease: a systematic review and dose-response meta-analysis, Eur J Nutr 58(6):2243-2251 (2019).
Atkinson F.S., Foster-Powell K., Brand-Miller J.C., International tables of glycemic index and glycemic load values: 2008, Diabetes Care 31(12):2281-2283 (2008). Fernandes G., Velangi A., Wolever T.M.S., Glycemic index of potatoes commonly consumed in North America, J Am Diet Assoc 105(4):557-562 (2005). Ek K.L. et al., Discovery of a low-glycaemic index potato and relationship with starch digestion in vitro, Br J Nutr 111(4):699-705 (2014).
Raatz S.K. et al., Resistant starch analysis of commonly consumed potatoes: content varies by cooking method and service temperature but not by variety, Food Chem 208:297-300 (2016), with averages from the authors' 2013 release. Leeman M., Östman E., Björck I., Vinegar dressing and cold storage of potatoes lowers postprandial glycaemic and insulinaemic responses in healthy subjects, Eur J Clin Nutr 59(11):1266-1271 (2005). Patterson M.A. et al., Chilled potatoes decrease postprandial glucose, insulin, and glucose-dependent insulinotropic peptide compared to boiled potatoes in females with elevated fasting glucose and insulin, Nutrients 11(9):2066 (2019). Devlin B.L. et al., Lower nocturnal blood glucose response to a potato-based mixed evening meal compared to rice in individuals with type 2 diabetes, Clin Nutr 40(4):2200-2209 (2021).
USDA FoodData Central, SR Legacy: potatoes boiled without skin (170440), baked flesh and skin (170093), fast-food french fries (170698), frozen fries oven-heated (170452), white rice cooked (168878). Commission Regulation (EU) 2017/2158 on acrylamide benchmark levels; EFSA, Scientific opinion on acrylamide in food (2015). Scott G.J., Petsakos A., Suarez V., Not by bread alone: estimating potato demand in India in 2030, Potato Research 62:281-304 (2019). USDA FSIS, Leftovers and food safety.