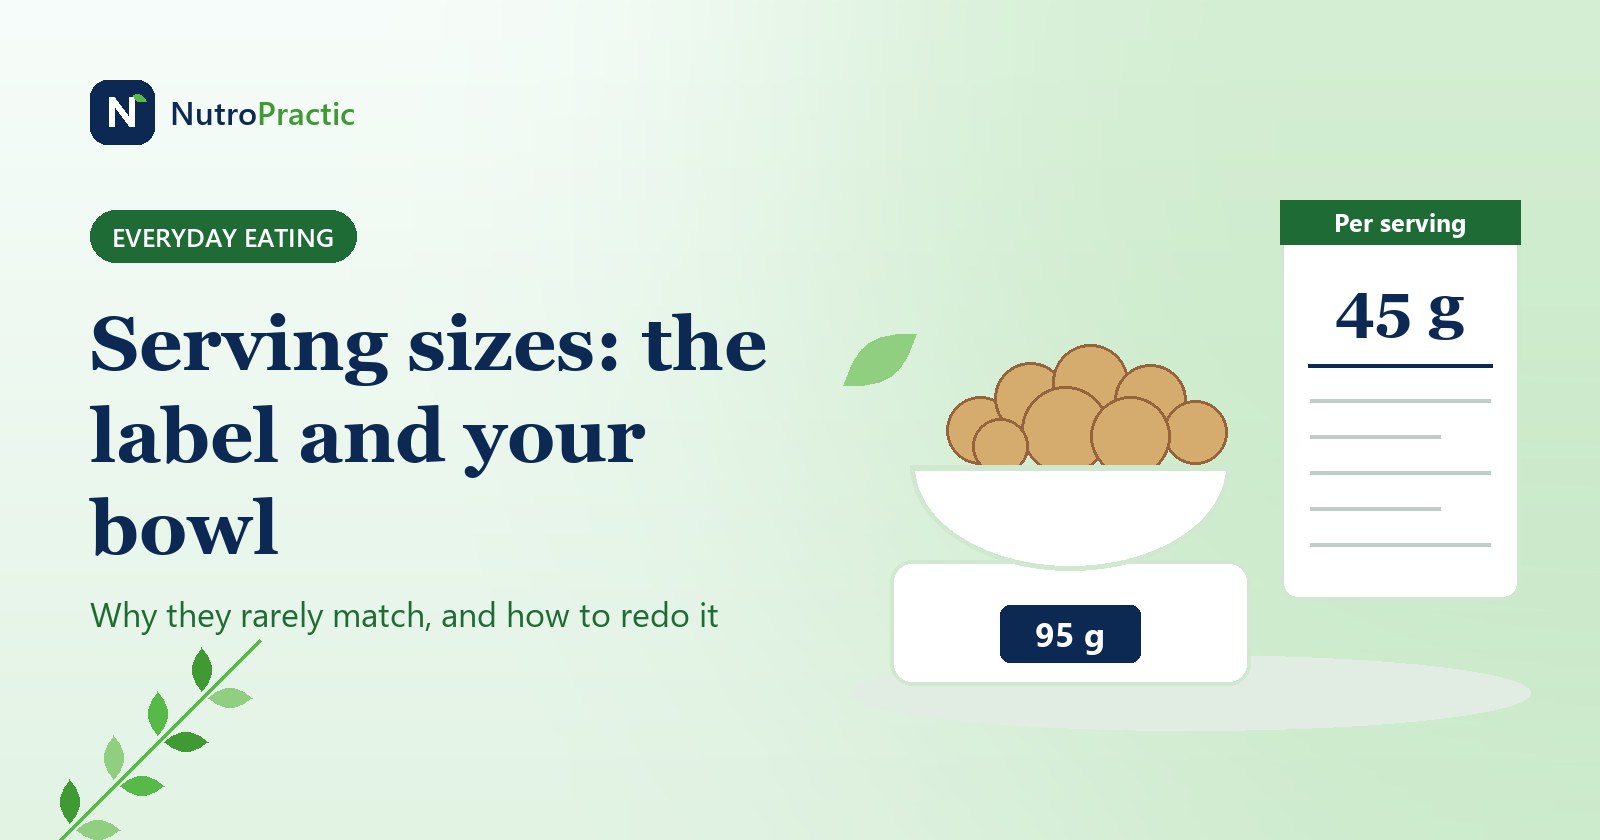
Most of us read the calories on a pack and quietly assume they apply to what's in our bowl. Often they don't. The figure belongs to a serving, and that serving was set by a regulation or by the manufacturer. Nobody weighed your breakfast.
The fix takes a kitchen scale and a minute of arithmetic. First, though, it helps to know where these numbers come from, because the answer differs by country and explains why the same juice can have two serving sizes. Pack figures below come from label records on Open Food Facts, read on 3 November 2026. Recipes change, so treat them as worked examples.
Where the number comes from
In the US, serving sizes are built on a government table called the Reference Amounts Customarily Consumed, or RACC. The word that matters is consumed. The FDA says plainly that a serving size "is not a recommendation of how much to eat or drink", and its 2016 rule repeats that RACCs "are not recommended amounts". They describe what Americans reported eating.
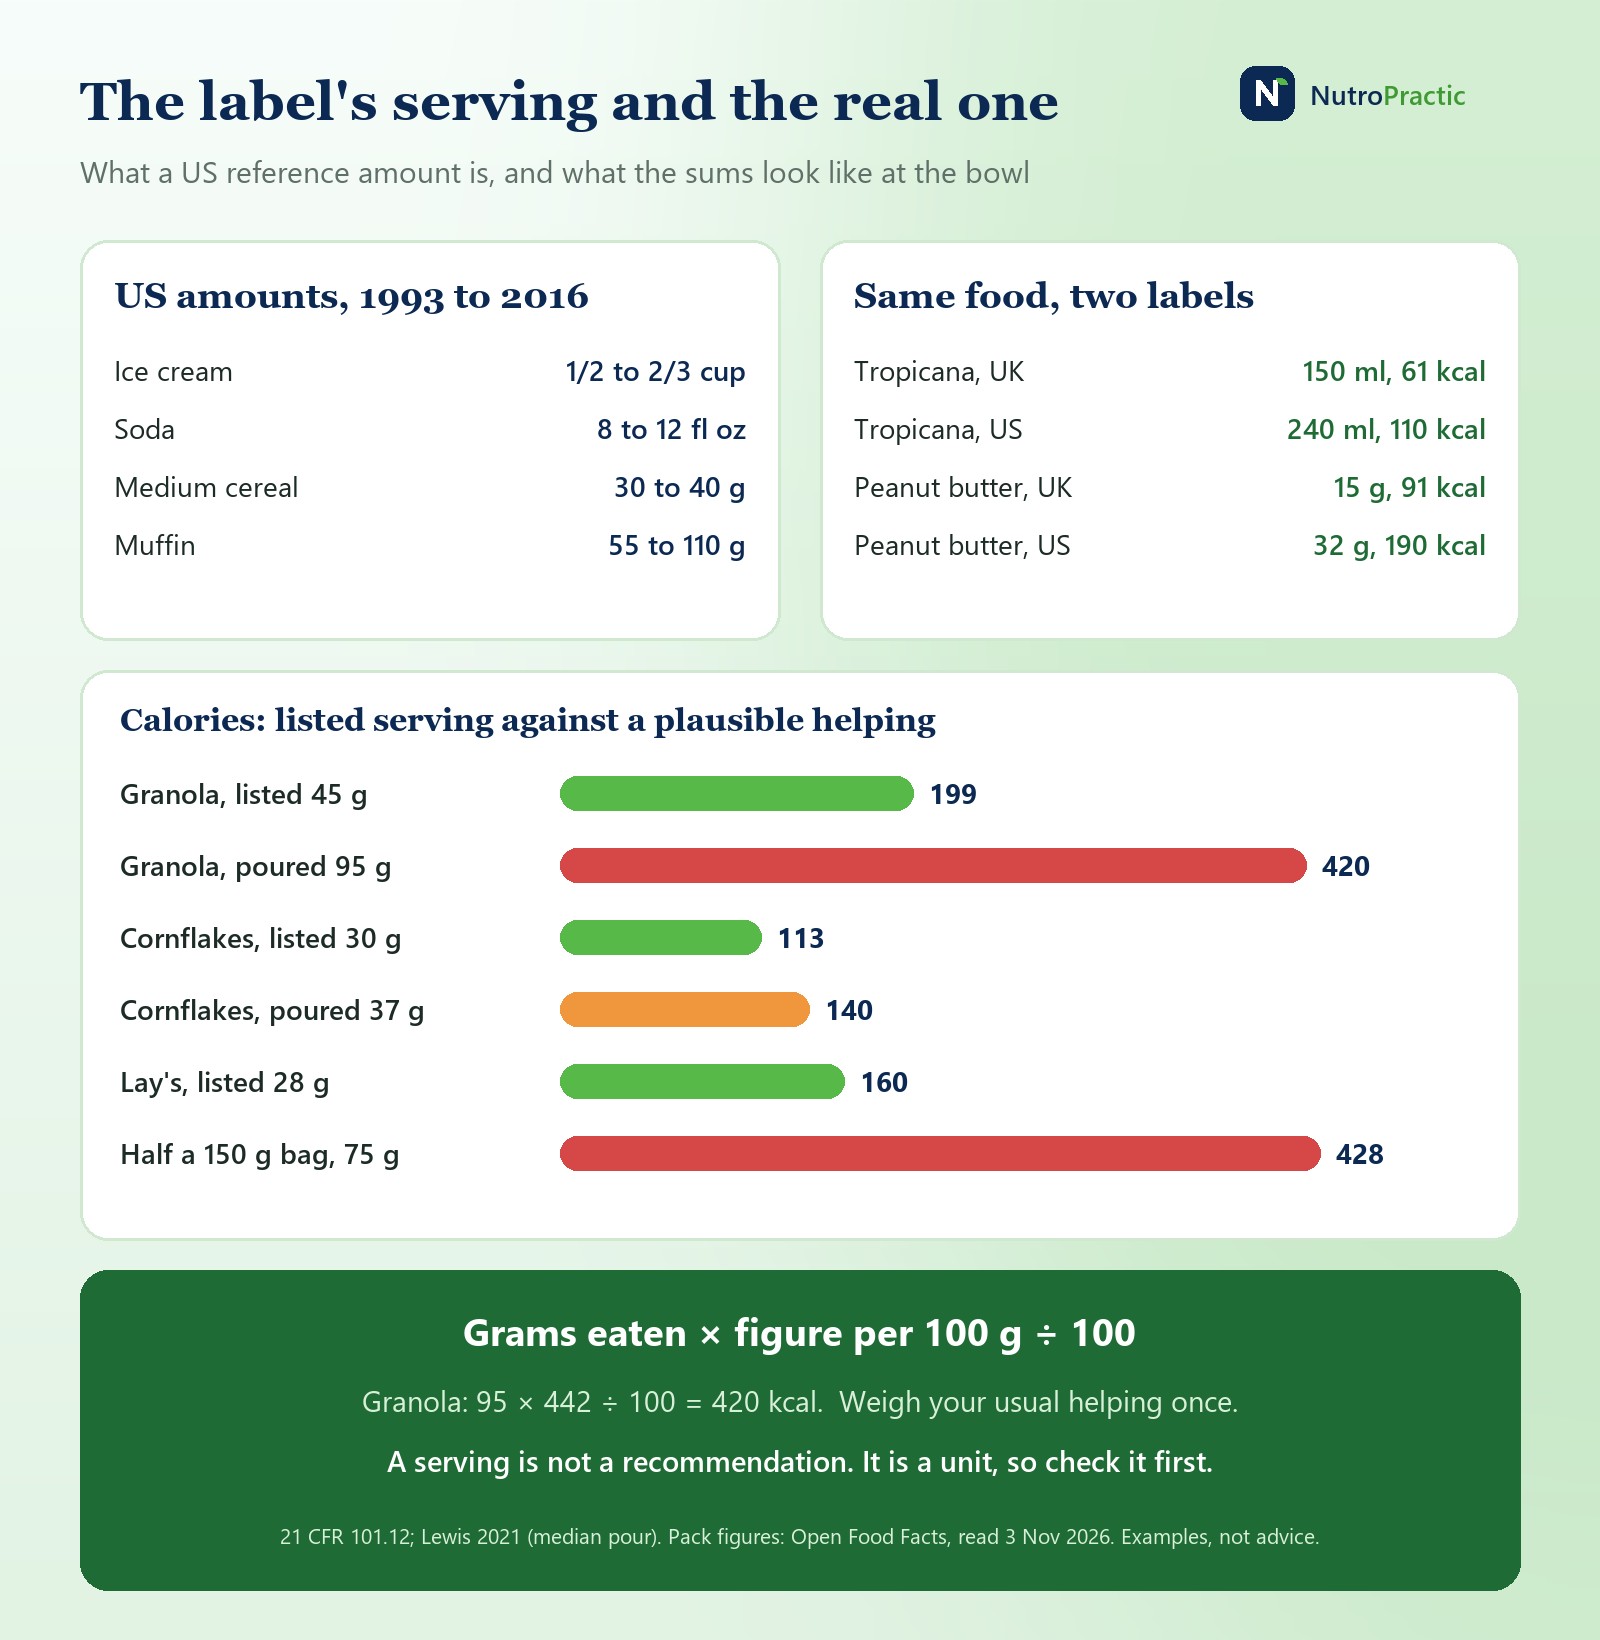
That 2016 rule replaced figures drawn from food surveys of 1977-78 and 1987-88 with national survey data from 2003-2008, and the FDA generally changed an amount when the median had moved by 25% or more. Some went up, and yogurt went down:
| Food (US reference amount) | 1993 rule | Since the 2016 rule |
|---|---|---|
| Ice cream | 1/2 cup | 2/3 cup |
| Soda and most other drinks | 8 fl oz (240 ml) | 12 fl oz (360 ml) |
| Ready-to-eat cereal, medium weight | 30 g | 40 g (survey median 39 g) |
| Ready-to-eat cereal, heavy | 55 g | 60 g |
| Muffins (bagels now share the category) | 55 g | 110 g |
| Yogurt | 225 g | 170 g |
| Juice | 240 ml | 240 ml, unchanged |
| Chips and similar snacks | 30 g | 30 g, unchanged |
| Nut butters | 2 tbsp | 2 tbsp, unchanged |
So a bigger serving on an ice cream tub doesn't mean anyone decided you should eat more. It means people already did. Bear in mind too that the data behind today's labels is now about 20 years old.
The same rule closed a loophole on packages. Anything holding under 200% of the reference amount must be labelled as one serving, so a 20 oz bottle of soda (167% of 12 oz) is one serving, not two and a bit. From 200% to 300%, the label needs a second column for the whole container, which catches a 24 oz bottle and a pint of ice cream (2 cups, exactly 300% of 2/3 cup). Above that, one column per serving is allowed again, and a large bag of chips can still show a single 1 oz serving and leave the rest to you.
In the EU and UK, the mandatory figures are per 100 g or 100 ml, and the per-portion column is an optional extra alongside them. The size of that portion is chosen by the company. The UK Food Standards Agency says as much in its labelling leaflet: the portion "is decided by the food business operator". There are voluntary industry norms, such as the European Snacks Association's suggested 30 g for crisps and nuts. Nothing makes one brand's portion comparable with another's, so in Europe the 100 g column is your friend and the portion column isn't to be trusted without a look at the weight.
In India, FSSAI's Labelling and Display Regulations 2020 ask for nutrition per 100 g or 100 ml, or per single-consumption pack, plus each serve's percentage contribution to the recommended daily amounts, worked out on 2,000 kcal. The ICMR-NIN 2024 dietary guidelines tell readers to check the serving size for this reason. A percentage on an Indian pack is only true for the serve printed beside it.
The same food, two serving sizes
| Food | One label | Another label |
|---|---|---|
| Tropicana orange juice | UK record: 150 ml, 61 kcal | US record: 240 ml, 110 kcal |
| Smooth peanut butter | Meridian (UK): 15 g, 91 kcal | Skippy (US): 2 tbsp, 32 g, 190 kcal |
| Breakfast cereal | Kellogg's Corn Flakes (UK): 30 g, 113 kcal | Cheerios (US): 1½ cups, 39 g, 140 kcal |
| Crisps and chips | European industry suggestion: 30 g | Lay's Classic (US): 28 g, about 15 chips, 160 kcal |
Look at the peanut butter. Per gram the two are close: 607 kcal per 100 g against 594. The US jar looks twice as calorie-heavy only because its spoonful is twice as big. Put 32 g of the British one on your toast and you're at 194 kcal.
How far off we are
At the cereal box. A 2021 University of Chester study (Lewis and colleagues) had 169 adults pour one cereal from each of seven categories as if serving themselves. Pours beat the recommended serving in every category. Granola was the outlier, with a median pour of 95 g, 50 g above the serving, and a range running from 24 g under to 267 g over. For flaked cereal the median gap was only 7 g, and for biscuit-style cereals it was zero. Denser food is easier to overdo, because a bowl full of granola weighs far more than a bowl full of flakes.
Consumer Reports found something similar in 2014, in a less formal test of 124 shoppers in Yonkers, New York: 92% poured more than the listed serving. With a 12 oz bowl they poured 24% to 92% over, and with a 28 oz bowl the average pour was 132% over for Cheerios and 282% over for granola. Listed servings have since changed, so read those as a guide to the effect of bowl size.
By eye. In a small lab study at Cambridge (Almiron-Roig and colleagues, 2013: 32 adults, 33 foods), people judging how many reference portions they were looking at came in low overall, and by 30% to 46% for drinks and medium-density foods such as pizza and pasta. They actually overestimated for high-energy-density foods. So you can't assume your eye errs in one direction.
In general. A 2015 Cochrane review (Hollands and colleagues, 72 studies) found people consistently eat and drink more when offered larger portions or packages. The authors estimated that removing larger sizes across the diet could cut daily energy from food by 12% to 16% in UK adults and 22% to 29% in US adults. The trials were short and many carried unclear or high risk of bias, so nobody knows if the effect lasts.
Three recalculations
There's one formula: grams you ate × figure per 100 g ÷ 100. If a label only gives a per-serving figure, divide what you ate by the serving and multiply. Everything below uses it.
Cereal
The poured weights here are the Chester medians for that type of cereal, applied to two common packs. Nobody in that study was necessarily eating these brands.
| Per helping | Weight | kcal | Sugars | Other |
|---|---|---|---|---|
| Dorset Nutty Granola, listed | 45 g | 199 | 5.9 g | Fibre 2.8 g |
| Same granola, median pour | 95 g | 420 | 12.4 g | Fibre 5.9 g |
| Kellogg's Corn Flakes, listed | 30 g | 113 | 2.4 g | Salt 0.33 g |
| Same flakes, median pour | 37 g | 140 | 3.0 g | Salt 0.41 g |
Worked through for the granola: 95 × 442 ÷ 100 = 420 kcal. Milk comes on top. The gap isn't a reason to give up granola, which brought 5.9 g of fibre with it in that bigger bowl. It's a reason to know it's a 420 kcal breakfast, not a 199 one.
Crisps
Lay's Classic in the US gives 28 g, about 15 chips, at 160 kcal. That's about 1.9 g a chip, so you can count your way through this one. The two US records we checked list 500 and 607 mg of sodium per 100 g, so the sodium below is a range.
| Amount | Weight | kcal | Sodium |
|---|---|---|---|
| Listed serving, about 15 chips | 28 g | 160 | 140-170 mg |
| About 30 chips | 56 g | 320 | 280-340 mg |
| Half of a 150 g sharing bag | 75 g | 428 | 375-455 mg |
Lay's Classic Salted sold in India is listed at 554 kcal per 100 g, so the same sum works with its printed pack weight: for a 50 g bag, 50 × 554 ÷ 100 = 277 kcal. With any single pack, work out the whole bag first. Few people stop a third of the way through.
Peanut butter
This is the one to weigh, because nobody really measures a level tablespoon. USDA's household figure is 16 g for one. We couldn't find a good study of how much people spread on toast, so the helpings below are illustrations. Put your jar on the scale, make your toast, and weigh the jar again. The difference is your number.
| Helping (Meridian smooth, 607 kcal per 100 g) | Weight | kcal |
|---|---|---|
| Listed UK portion | 15 g | 91 |
| One level US tablespoon | 16 g | 97 |
| A generous scrape | 25 g | 152 |
| Two level tablespoons, the US serving | 32 g | 194 |
| Thick on two slices | 40 g | 243 |
Why this gets more important in the US
The FDA's January 2025 proposal for a front-of-pack box would rate saturated fat, sodium and added sugars as Low, Med or High per serving: Low at 5% of the Daily Value or less, High at 20% or more. We found no final rule as of 3 November 2026. Reports through mid-2026 still described the agency as reviewing it, and it may change.
If it does arrive in this form, your helping decides how much the word is worth. Skippy peanut butter, for example, has about 3 g of saturated fat per 32 g, which is 15% of the 20 g Daily Value: Med. One and a half servings is 22%, which would be High territory on your toast, though the jar still says Med. Lay's at 170 mg of sodium is 7% and Med; three servings, about 45 chips or 84 g, reach 22%. A label can only rate the amount it assumes.
Our guide to front-of-pack labels walks through that box and how Nutri-Score and UK traffic lights differ. Claims are a separate trap, and our label claims guide goes through those. If salt is your concern, the free sodium counter adds up a whole day.
How to do it at home
1. Find the weight first. Look for the grams or millilitres beside the serving, not just "1 cup" or "2 biscuits". 2. Compare on 100 g when you're choosing between two products. It's the only column where the maker can't choose the unit. 3. Weigh your usual helping, using your usual bowl, spoon or glass. Give it three mornings if it's something you pour by eye. You only need to do this for the five or six foods you eat most. 4. Note the number on the pack or the cupboard door: "my granola = 70 g = 309 kcal". 5. Scale everything else with it, including the percentages. If your helping is twice the serve, then so is every percentage on an Indian or US label.
Doing this doesn't mean you have to eat the listed serving. Listed serving and healthy amount were never the same thing. A growing teenager or a keen cyclist may want more than 45 g of granola. The aim is only to know what's in the bowl.
A serving size is a unit of measurement that happens to be printed in large type. Check that it's your unit before you believe the number beside it.
Trying to manage weight, blood sugar or blood pressure without counting everything? Dr. Triveni can look at the foods and helpings you actually eat and work out what's worth changing, in a virtual consultation.
Book a consultationThis article is general label-reading information, not medical advice. If you count carbohydrate for insulin dosing or follow a renal or other medical diet, use your care team's method. Brands are named only as worked examples; we have no link to them, and recipes and labels change.
Sources
FDA, Food labeling: serving sizes of foods that can reasonably be consumed at one eating occasion, 81 FR 34000 (27 May 2016), including the 21 CFR 101.12(b) tables, the 25% test and the 200% and 300% package rules. FDA, Serving size on the Nutrition Facts label. Changes to beverage serving sizes, SupplySide; Trustwell RACC summary.
UK Food Standards Agency, nutrition labelling leaflet. Food Standards Scotland, nutrition declarations. FoodDrinkEurope, portion guidance, including the European Snacks Association's 30 g. FSSAI, direction on declaring RDA percentages, Labelling and Display Regulations 2020, as summarised by APEDA. Coverage of the ICMR-NIN 2024 guidelines on labels: Down To Earth.
Lewis I.M., Boote L., Butler T., Effect of breakfast cereal type on portion size and nutritional implications, Public Health Nutr 24(11):3276-3285 (2021). Consumer Reports, Cereal portion control matters (2014). Almiron-Roig E. et al., Estimating food portions: influence of unit number, meal type and energy density, Appetite 71:95-103 (2013). Hollands G.J. et al., Portion, package or tableware size for changing selection and consumption of food, alcohol and tobacco, Cochrane Database Syst Rev (2015).
FDA front-of-pack proposal: Gibson Dunn summary (2025); status: InfoLawGroup (June 2026), docket FDA-2024-N-2910.
Product data from Open Food Facts, read 3 November 2026: Tropicana Smooth Orange, UK, Tropicana No Pulp, US, Meridian Smooth, Skippy Creamy, Corn Flakes, Cheerios, Dorset Nutty Granola, Lay's Classic, Lay's Classic, second record and Lay's Classic Salted, India. Tablespoon weight: USDA FoodData Central.