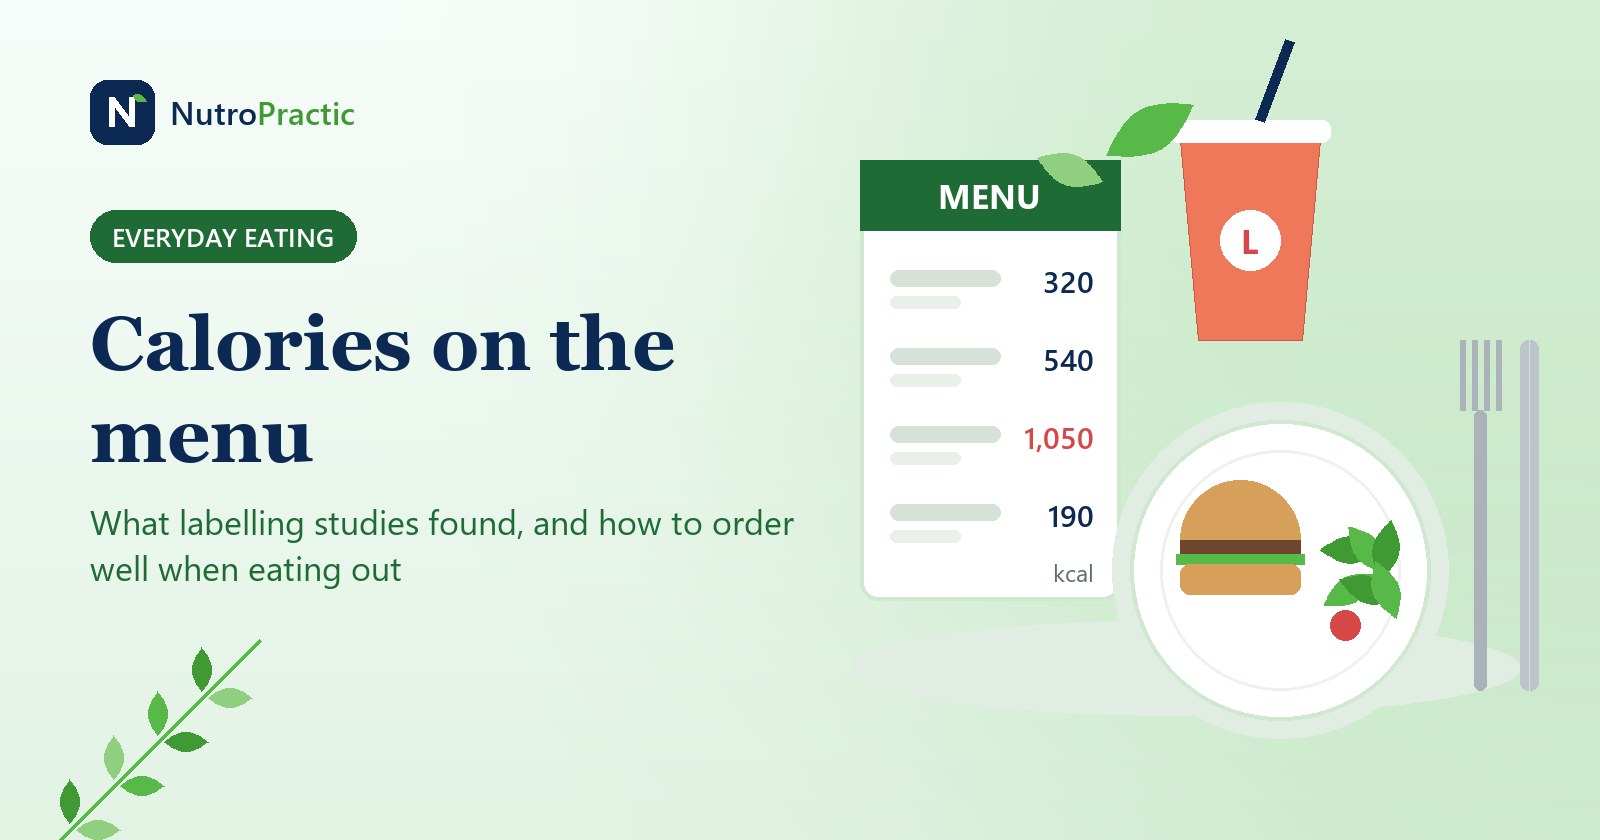
Since May 2018, every restaurant chain in the United States with 20 or more outlets has had to print calories next to each item on its menu. England followed in April 2022 for food businesses with 250 or more staff, Ontario did it in 2017, and India in 2022 for chains with ten or more outlets. The idea was simple: if people could see that the muffin had 480 calories, they would pick something else.
Fifteen years of studies have now measured what actually happened at the till. The short answer: labels move orders a little, for some people, for a while. The bigger lever is in how restaurant meals are built and how we order them. Here is what the labelling research found, how many calories a typical restaurant meal carries, what eating out often does to weight in long-term studies, and five ordering habits backed by numbers.
What the rules require
United States (FDA, in force 7 May 2018): chains with 20 or more locations show calories for every standard item on menus, menu boards and drive-throughs, plus the line "2,000 calories a day is used for general nutrition advice, but calorie needs vary". Fat, saturated fat, sodium, sugars, fibre and protein must be available in writing on request.
England (in force 6 April 2022): businesses with 250 or more employees show kcal and the portion size at the point of choice, including online menus and delivery apps, with the statement "adults need around 2000 kcal a day". Schools, hospitals and workplace canteens are exempt.
Ontario (Healthy Menu Choices Act, 1 January 2017): chains with 20 or more Ontario outlets, with a reference of 2,000 Cal a day for adults and 1,500 Cal for children aged 4 to 12.
India (FSSAI Labelling and Display Regulations 2020, in force 1 January 2022): food businesses with a central licence or outlets in ten or more locations show kcal per serving and the serving size next to each item. FSSAI did not start checking the figures until July 2022.
What happened when the calories went up
New York City was first, in 2008, which made it the natural test. Elbel and colleagues (Health Affairs, 2009) collected receipts from 1,156 adults at fast-food outlets in low-income New York neighbourhoods and in Newark, New Jersey, which had no labels. About 28% of those who noticed the labels said the labels had influenced their order, but the receipts showed no drop: about 825 kcal per order before and 846 after.
The city's health department ran a much larger survey (Dumanovsky and colleagues, BMJ 2011): 7,309 lunchtime customers at 168 outlets of the 11 biggest chains in 2007, and 8,489 in 2009. Across all customers, the calories bought did not change. Some chains fell (McDonald's from 829 to 785 kcal per order, KFC from 927 to 868, Au Bon Pain from 555 to 475), and Subway rose from 749 to 882. The group that clearly changed was the one customer in six who said they used the calorie information: they bought 106 kcal less than those who didn't.
Starbucks gave economists something rarer: every transaction. Bollinger, Leslie and Sorensen (American Economic Journal: Economic Policy, 2011) compared millions of purchases in New York with Boston and Philadelphia. Calories per transaction fell by about 6%, from 247 to 232 kcal, and the drop lasted. Almost all of it came from food, not drinks: food calories per transaction fell about 14%, mostly because people bought fewer pastries rather than lighter ones.
The largest study comes from the national rule. Petimar and colleagues (BMJ 2019) tracked 49 million transactions at 104 restaurants of one fast-food franchise in the southern US. When labels went up in 2017, calories per transaction dropped by 60 kcal (about 4%), then crept back to about 23 kcal less after a year. Following the same franchise for longer (PLoS Medicine 2021), they found orders still about 73 kcal, or 4.7%, lower than expected at the end of the study.
England's 2022 rule has been evaluated too. Polden and colleagues (Nature Human Behaviour, 2024) surveyed 6,578 customers leaving 330 outlets before and after the rule: more people noticed and used the labels, and they underestimated their meal less, but the calories bought did not change significantly. A separate study of 78 UK chains found menu items in sit-down restaurants dropped by about 38 kcal each in the first year, while fast-food items went up by 42 kcal.
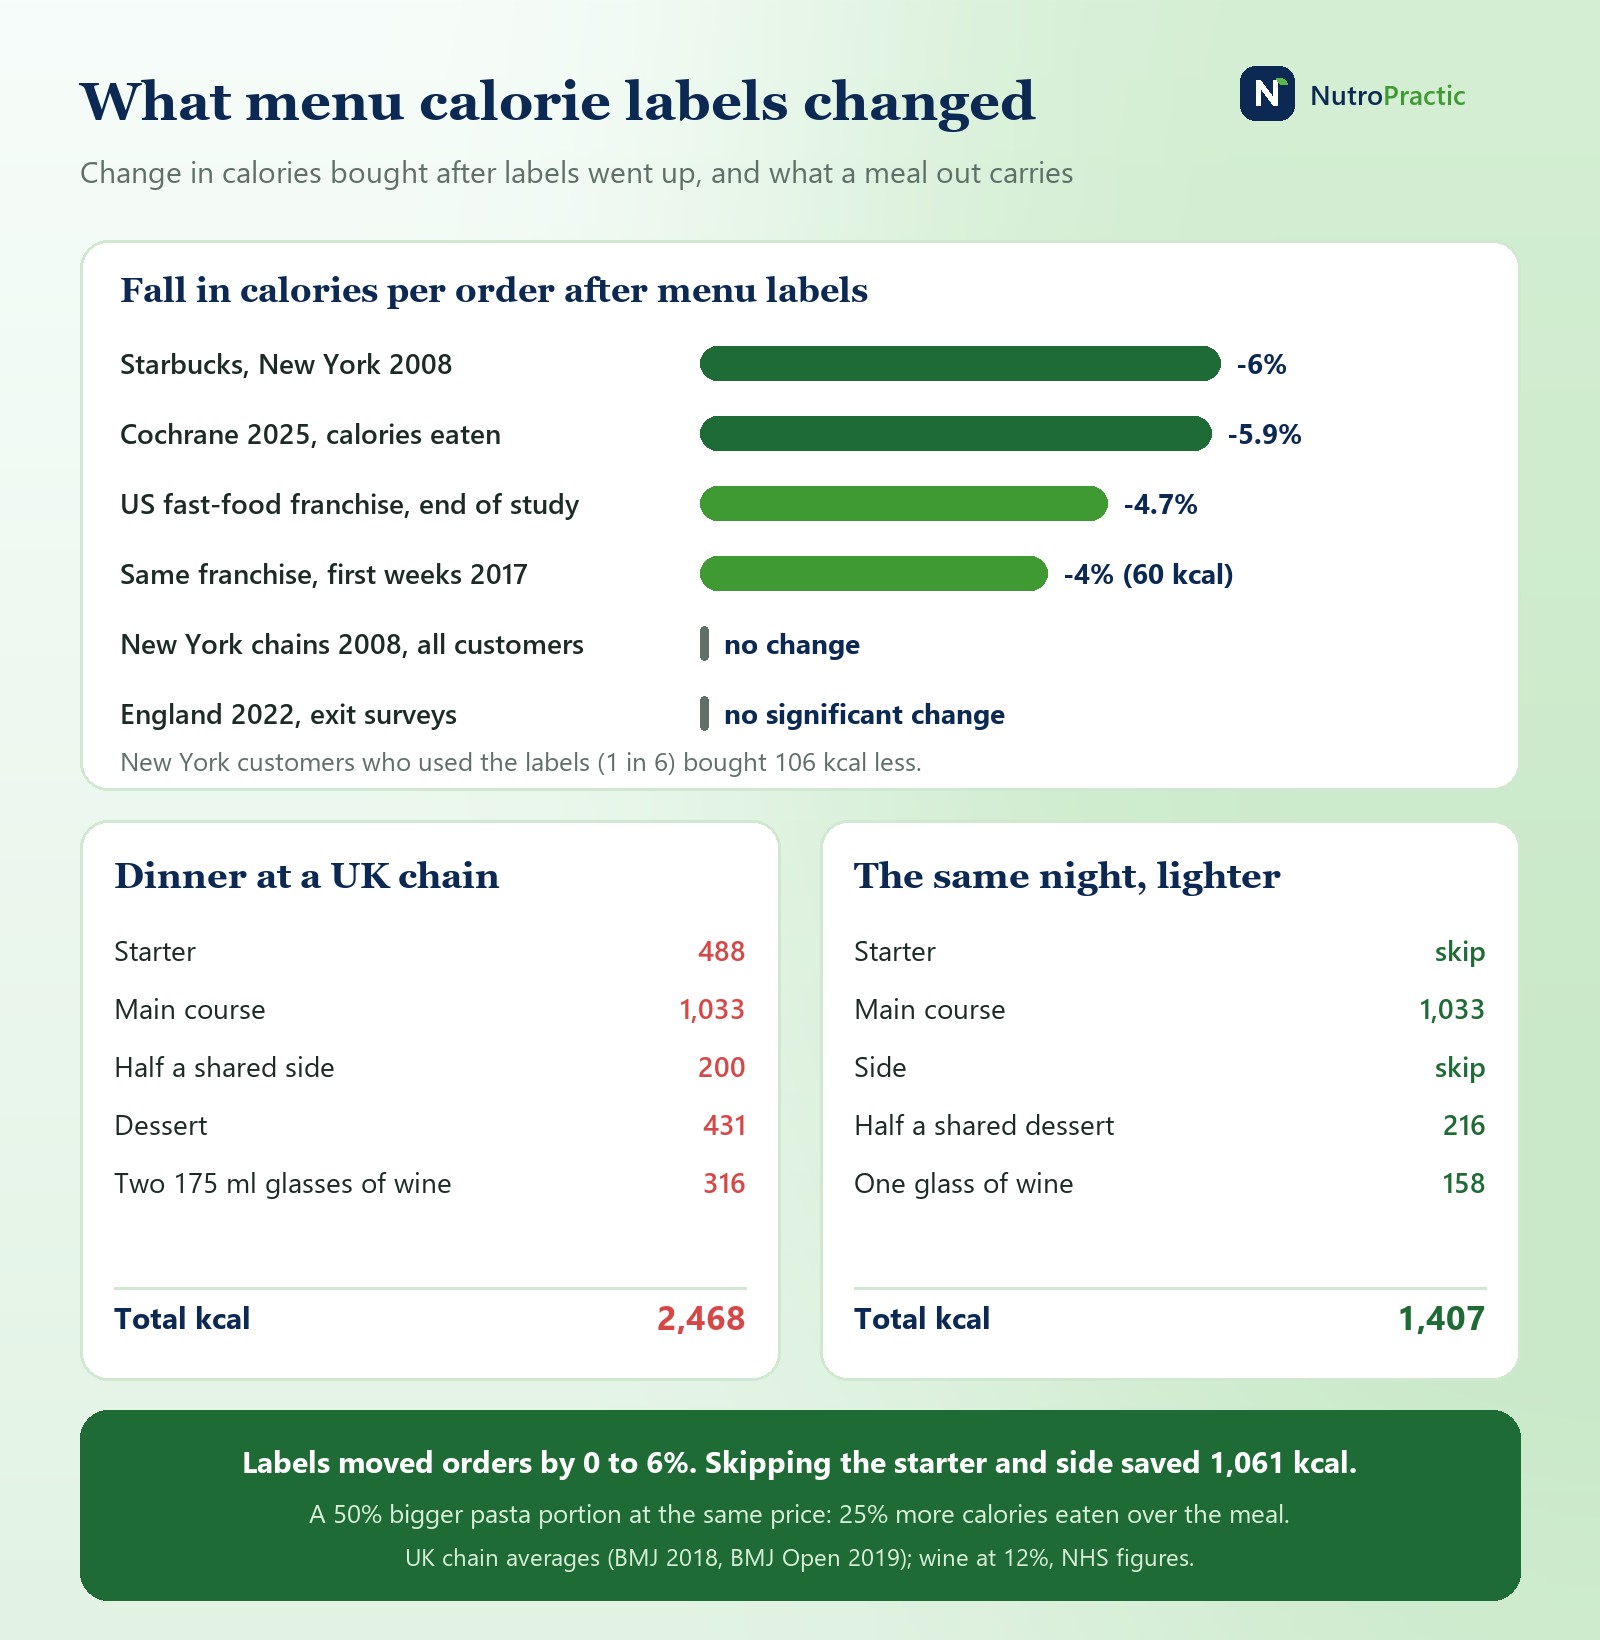
Pulling the controlled studies together, the 2025 Cochrane review (25 studies) estimated that for a 600 kcal meal, labels cut the calories chosen by about 11 kcal (1.8%) and the calories eaten by about 35 kcal (5.9%). An earlier Cochrane review (2018) put it at 47 kcal. There is one hint of a longer-term effect: comparing New York counties that brought in labels at different times, Restrepo (Health Economics, 2017) found BMI about 1.5% lower after labelling, more so in lower-income groups. That is an observational result, and it hasn't been repeated for the national rule yet.
So labels work best for people who already want to use them, and a 4 to 6% drop is real but small. That is no reason to ignore them. It means the number on the menu is a tool you have to pick up yourself.
How big a restaurant meal really is
A few percent doesn't solve much because of the starting point. When Tufts University researchers bought 364 meals from 123 restaurants in San Francisco, Boston and Little Rock and measured their energy in a lab (Urban and colleagues, Journal of the Academy of Nutrition and Dietetics, 2016), non-chain restaurant meals averaged 1,205 kcal, no different from the big chains, and 92% were above the calories recommended for one meal. An international follow-up (BMJ 2018) found the same in Brazil, Finland, Ghana and India: 94% of full-service meals and 72% of fast-food meals were 600 kcal or more. Only China came in lower than the US (719 against 1,088 kcal).
In the UK, a survey of 13,396 main courses from 27 chains (Robinson and colleagues, BMJ 2018) found an average of 977 kcal for the main course alone, before drinks, starters, sides or dessert; 47% were 1,000 kcal or more and only 9% were under 600. A companion study (BMJ Open 2019) put the average starter at 488 kcal, side at 398 kcal and dessert at 431 kcal.
A worked evening out
Take a sit-down dinner at a UK chain using those averages: a starter (488 kcal), a main (1,033 kcal, the full-service average), half of a shared side (about 200 kcal), a dessert (431 kcal) and two 175 ml glasses of 12% wine (up to 158 kcal each, NHS figures). That comes to about 2,470 kcal in one meal, more than the 2,000 kcal reference printed on the menu. The same evening with the main, one glass of wine and half a shared dessert is 1,033 + 158 + 216 = 1,407 kcal: still a big meal, but about 1,060 kcal less, and the main course is untouched.
And restaurants are a growing share of what we eat. In US dietary surveys, food from restaurants and takeaways supplied 33.7% of calories in 2011 to 2014, up from 17.8% in 1977 to 1978 (USDA Economic Research Service), and in 2023 Americans spent 58.5% of their food budget on food away from home, a record.
How often you eat out matters more than any one meal
In long-term studies the pattern is consistent, if not proof of cause. A review of seven prospective studies (Nago and colleagues, 2014) linked frequent eating out, and fast food most strongly, with weight gain and overweight. In Cambridgeshire, England, people with the most takeaway outlets around home, work and commute had a BMI 1.21 points higher and 80% higher odds of obesity than those with the fewest (Burgoine and colleagues, BMJ 2014, 5,442 adults). In US national survey data on 35,084 adults followed for up to 15 years, those who ate two or more meals a day prepared away from home had a 49% higher death rate than those who did so less than once a week (Du and colleagues, J Acad Nutr Diet, 2021).
None of these studies can separate the food from everything else that comes with a rushed, eat-on-the-go life. But they point the same way as the meal measurements: one restaurant meal a week is a detail, one a day is your diet.
Five ordering habits that cut the most
1. Decide on the size before the dish. Portion size is one of the strongest effects in food research. When a restaurant served a 50% larger pasta portion at the same price, diners ate 43% more pasta and 25% more calories (159 kcal) over the whole meal, and didn't rate it as too much (Diliberti and colleagues, Obesity Research, 2004). A Cochrane review of 72 studies estimated that removing larger portions could cut adults' daily intake by 12 to 16%. Order the small or lunch-size portion, share a main, or ask for half to be boxed before it arrives.
2. Drop one course, not the main. In the worked dinner above, the starter and dessert together were 919 kcal, almost a second main. Choose one of them, or share the dessert three ways.
3. Count the drinks. A pint of 5% beer has up to 222 kcal; a large 250 ml glass of 12% wine about 225. A sugary soft drink and a refill add more. Drinks don't fill you up the way food does. Water on the table first, and one alcoholic drink if you want it, is the easiest saving there is.
4. Read the number on the two dishes you are torn between. The customers who cut calories in the New York studies were the ones who looked. You don't have to choose the lowest item on the menu. Where there are no labels, the sides and sauces are the giveaway: chips or fries, creamy and buttery sauces, cheese and anything "loaded" carry the hidden hundreds, while grilled, steamed, tandoori and tomato-based dishes and vegetable sides usually carry less.
5. Eat out less often, and plan the takeaway. Given the cohort data, how often matters more than what you order once. If takeaway is a weekday habit, swap two nights for something quick at home and keep the takeaway for the meal you actually look forward to. Order it with a vegetable or salad side and plain rice or bread rather than fried, and skip the extra main "to share" that nobody shares.
Our article on ultra-processed foods covers the other half of eating out: what is in the food, not just how much. If the office canteen is your daily restaurant, see eating well at a desk job.
Menu labels moved orders by about 4 to 6%. A smaller portion or one course fewer moves them by hundreds of calories.
Eating out for work, or living on takeaway through a busy stretch? Dr. Triveni's weight loss and lifestyle plans include an eating-out guide built around the places you actually go, in a virtual consultation.
Book a consultationThis article is general information, not medical advice. If you have diabetes, kidney disease, a heart condition or a history of eating disorders, discuss changes in your diet with your doctor or dietitian.
Sources
US Food and Drug Administration, Menu labeling requirements (final rule 2014, compliance 7 May 2018; 21 CFR 101.11). The Calorie Labelling (Out of Home Sector) (England) Regulations 2021, SI 2021/909. Government of Ontario, Guide to menu labelling requirements. FSSAI, Guidance note on labelling and display (2022).
Elbel B. et al., Calorie labeling and food choices: a first look at the effects on low-income people in New York City, Health Affairs 28(6):w1110-w1121 (2009). Dumanovsky T. et al., Changes in energy content of lunchtime purchases from fast food restaurants after introduction of calorie labelling: cross sectional customer surveys, BMJ 343:d4464 (2011). Bollinger B., Leslie P., Sorensen A., Calorie posting in chain restaurants, American Economic Journal: Economic Policy 3(1):91-128 (2011), and NBER working paper w15648 (2010). Restrepo B.J., Calorie labeling in chain restaurants and body weight: evidence from New York, Health Economics 26(10):1191-1209 (2017).
Petimar J. et al., Estimating the effect of calorie menu labeling on calories purchased in a large restaurant franchise in the southern United States, BMJ 367:l5837 (2019). Petimar J. et al., longer follow-up of calorie labelling in the same franchise, PLoS Medicine 18(7):e1003714 (2021). Polden M. et al., kilocalories purchased and consumed in the out-of-home sector before and after mandatory calorie labelling in England, Nature Human Behaviour (2024). Kalbus A., Rinaldi C., commentary on the England calorie labelling evaluations, including the 78-chain menu study, Public Health Nutrition 28:e125 (2025). Crockett R.A. et al., Nutritional labelling for healthier food or non-alcoholic drink purchasing and consumption, Cochrane (2018). Clarke N. et al., Energy (calorie) labelling for healthier selection and consumption of food or alcohol, Cochrane CD014845 (2025), UCL summary.
Urban L.E. et al., Energy contents of frequently ordered restaurant meals and comparison with human energy requirements and US Department of Agriculture database information, J Acad Nutr Diet 116(4):590-598 (2016). Roberts S.B. et al., Measured energy content of frequently purchased restaurant meals: multi-country cross sectional study, BMJ 363:k4864 (2018). Robinson E. et al., (Over)eating out at major UK restaurant chains: observational study of energy content of main meals, BMJ 363:k4982 (2018). Muc M. et al., A bit or a lot on the side? Observational study of the energy content of starters, sides and desserts in major UK restaurant chains, BMJ Open 9:e029679 (2019). NHS, Calories in alcohol. USDA Economic Research Service, share of calories from food away from home and food spending in 2023.
Nago E.S. et al., Association of out-of-home eating with anthropometric changes: a systematic review of prospective studies, Crit Rev Food Sci Nutr 54(9):1103-1116 (2014). Burgoine T. et al., Associations between exposure to takeaway food outlets, takeaway food consumption, and body weight in Cambridgeshire, UK, BMJ 348:g1464 (2014). Du Y. et al., Frequency of eating meals prepared away from home and all-cause and cause-specific mortality, J Acad Nutr Diet 121(9) (2021). Diliberti N. et al., Increased portion size leads to increased energy intake in a restaurant meal, Obesity Research 12(3):562-568 (2004). Hollands G.J. et al., Portion, package or tableware size for changing selection and consumption of food, alcohol and tobacco, Cochrane (2015).