School meals · November 5, 2026
Put recess before lunch and children ate 9 more calories of fruit. Across 2,524 Virginia trays, overall lunch quality did not budge
Fruit waste was 36% after recess and 38% before it, a statistically neat but practically small gap. The study photographed one lunch at each school, so it cannot tell whether changing the timetable would change what children eat.
Does letting children run around before lunch make them hungrier for the food on their trays? Researchers compared 2,524 elementary-school lunches across ten Virginia schools. Six of every ten schools qualified for Title I support, 54% of enrolled pupils participated in the National School Lunch Program, and 1,656 of the photographed trays came from schools where recess happened before lunch.
The timetable made no detectable difference to the big measures. Lunches eaten after recess did not score higher overall on the Healthy Eating Index, and children did not consume more total energy. The differences sat almost entirely in fruit: 31 calories on average after recess, against 22 calories when recess followed lunch.
Fruit waste moved in the same direction, but only slightly. Children with recess first left 36% of their fruit by weight, compared with 38% among children due to play afterwards. Their Healthy Eating Index fruit scores were also a little higher: 2.7 versus 2.2 for total fruit and 3.0 versus 2.7 for whole fruit. Each difference was statistically significant, yet the two-percentage-point waste gap is far smaller than a headline about 'less waste' might suggest.
The researchers did not collect weeks of cafeteria records or move the same children between timetables. This was a secondary analysis of one day of tray photographs at each school during the 2019–2020 school year. Schools chose their own recess schedule, so their pupils, menus, lunch periods and cafeteria routines may have differed in ways the model could not fully remove.
Photographs are a strength because they do not rely on a child remembering what was eaten. A validated digital-imaging method estimated the food selected and left behind for each meal component. Even so, a picture of one school lunch cannot reveal what a child ate at breakfast, after school or at home, and it cannot establish that recess caused the fruit difference.
For schools, the finding is a reason to test rather than a reason to promise. Moving recess may be inexpensive and could nudge fruit consumption, but this study found no overall diet-quality or calorie gain. A stronger test would switch schedules prospectively, repeat measurements across menus and seasons, and follow the same schools long enough to see whether a two-point waste gap survives ordinary timetable changes.
What changed when recess came first
2,524 trays
Lunches assessed by digital photographs across ten Virginia elementary schools
1,656
Trays from schools where recess happened before lunch
31 vs 22 kcal
Average energy eaten from fruit after versus before recess; p<0.0001
36% vs 38%
Fruit left by weight after versus before recess; p=0.0001
2.7 vs 2.2
Healthy Eating Index total-fruit component scores; p<0.0001
No overall gap
Reverse recess was not associated with total lunch diet quality or total energy intake
Cross-sectional secondary analysis of one lunch observation per school in 2019–2020. Mixed models compared schools with different existing schedules; pupils were not randomly assigned and the same schools were not observed under both timetables. Values are group means, and statistical significance does not show that the schedule caused the differences.
- 'Reverse recess' means putting recess before lunch rather than after it; the name refers to the order, not a different kind of play period.
- The study used the Healthy Eating Index 2015, which scores how closely foods align with US dietary guidance. A component score can move even when the total score does not.
- The fruit-energy gap was 9 calories on average. That is a measure of fruit eaten, not a nine-calorie change in the whole lunch.
- A p-value can be very small when a difference is measured precisely across many trays. It does not tell readers whether a two-percentage-point waste gap is large enough to matter operationally.
- Sixty per cent of participating schools were Title I schools, a federal designation tied to serving communities with substantial numbers of children from low-income families.
- The researchers found grade-level interactions for protein foods and vegetables, but the abstract does not provide the grade-specific amounts; those should not be guessed from the p-values alone.
- How does reverse recess relate to lunch diet quality, energy intake, and plate waste among elementary students in Virginia?Journal of the Academy of Nutrition and Dietetics, 28 October 2026 · Primary study record; design, school and tray counts, digital-imaging method, fruit scores, energy, waste results and limitations checked against the indexed abstract.
- PubMed record 42951019US National Library of Medicine · Publication date, authors, methods, results and conclusion.
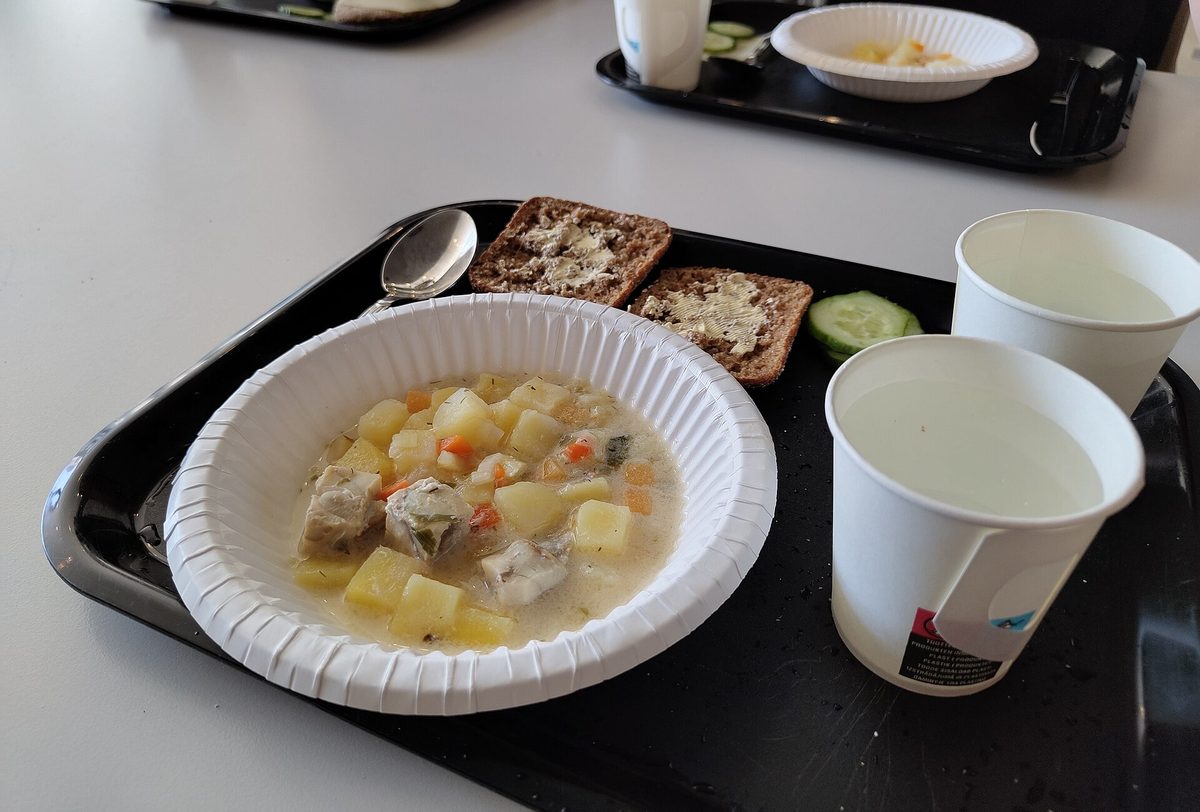
- School lunch in ylästö schoolWikimedia Commons · Photograph by Jukajuha, dedicated to the public domain under CC0; reused as a general school-meal illustration.
General information, not medical or school-policy advice. This observational comparison cannot show that moving recess changes children's diet, energy intake or food waste. Schools considering schedule changes should evaluate local menus, supervision, access needs and repeated waste measurements.
Analysis by NutroPractic from the sources listed. Written for general readers; it does not replace advice from your own doctor.
From our articles
Read, then eat a little better
Plain-language guides on nutrition and wellness, backed by research.
Diabetes
Pasta and blood sugar: al dente, cooled and reheated, and what the glucose tests measured
Head-to-head tests found little gap between 5 and 15 minutes of boiling. Chilling and reheating ranged from no change to a large drop. Moving from 80 g to 150 g adds 50 g of carbs. The tests, the sums, and legume and whole-wheat pastas per 100 g.
4 Nov 2026
Lifestyle
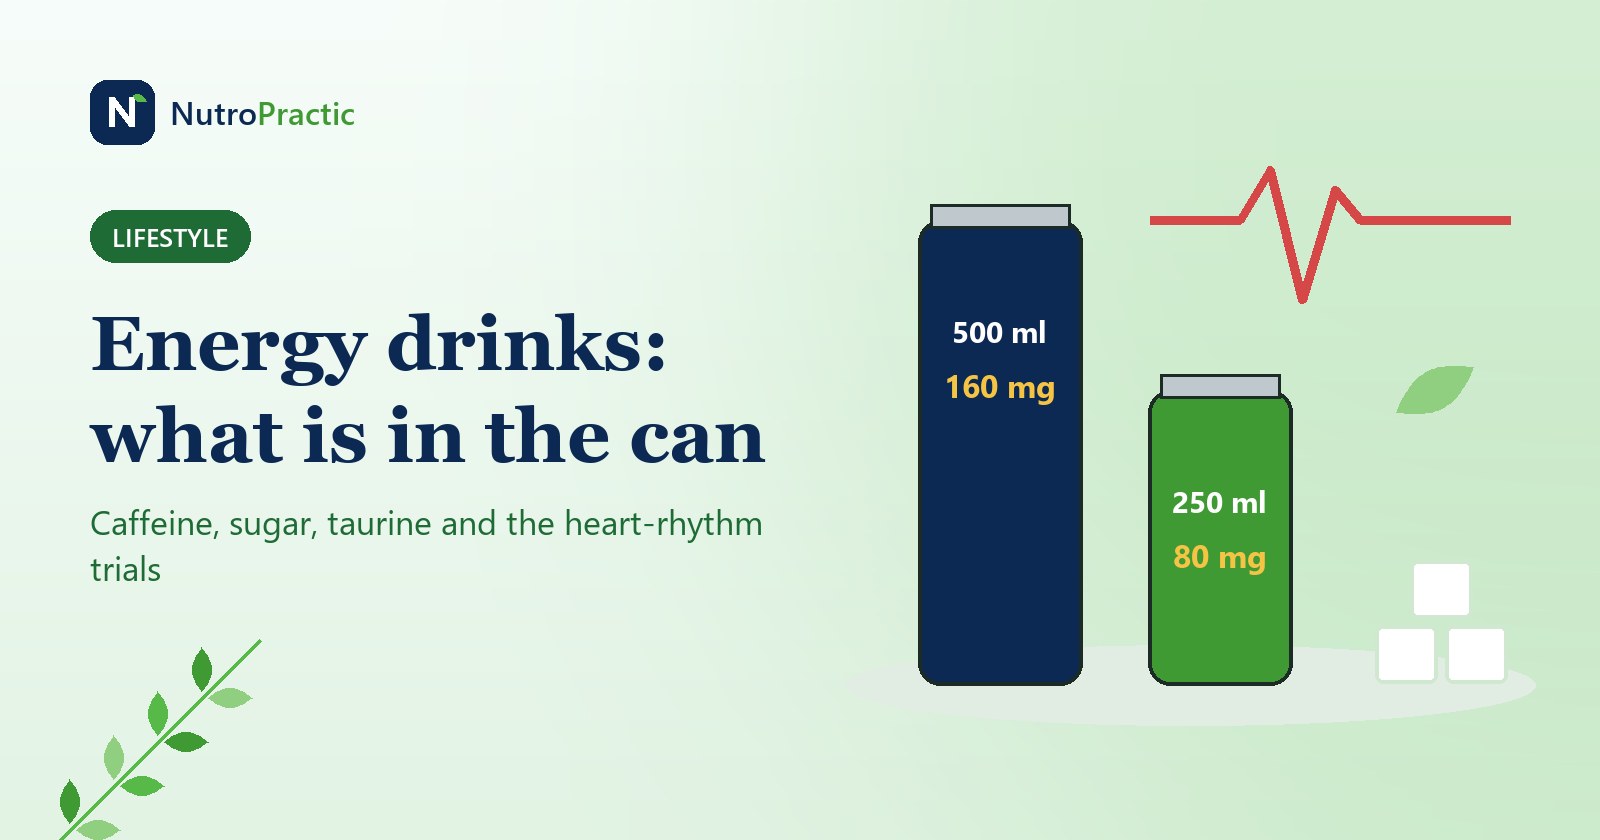
Energy drinks: caffeine, sugar and taurine per can, and what the emergency-visit and heart-rhythm studies found
From 80 mg to 300 mg of caffeine, and up to 55 g of sugar in one can. The numbers by brand, what they mean for a 50 kg teenager, what the QT and blood pressure trials measured, the old emergency-visit data and England's coming under-16 ban.
4 Nov 2026
Everyday eating
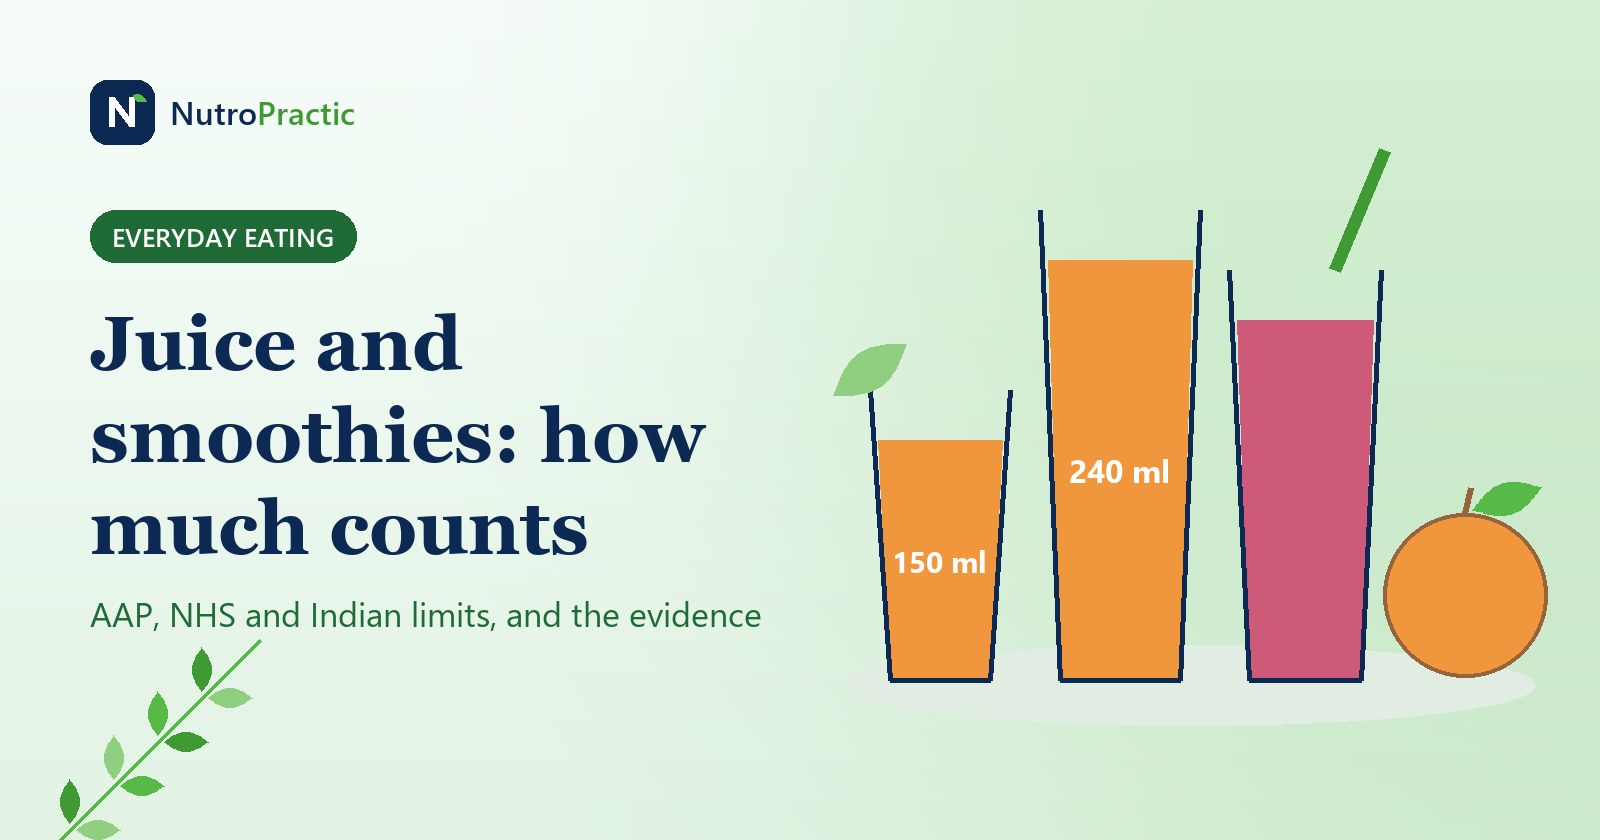
Fruit juice and smoothies for children and adults: how much counts, and what the AAP and NHS limits are based on
None under 1, 120 ml at 1 to 3, 150 ml for British adults, 250 ml for older Indian children. The limits side by side, sugar per glass against whole fruit, what the cohort studies on weight and diabetes found, and why smoothies are a closer call.
3 Nov 2026
Newsfeed for your website
Want this feed on your website?
Add it to any site with one copy-and-paste snippet. No sign-up, and it updates itself every hour.
Start with a virtual consultation
Tell Dr. Triveni what you want to change. You will leave with a clear next step, whether you are in Toronto, London, New York or Chennai.