Child weight · October 30, 2026
Shown a row of drawn children, 77 of 88 Shanghai parents whose preschooler carried extra weight picked a slimmer body than their child's
Researchers measured 520 children in eight Shanghai kindergartens, then asked their parents two things: which word described their child's weight, and which of seven drawings looked most like them. Words and pictures told quite different stories, and the pictures missed excess weight far more often.
Most parents think they would notice if their child were getting heavy. Decades of research say otherwise: parents, especially of young children, tend to see their child as lighter than the growth charts do. What is less clear is whether the answer depends on how you ask. A study published in Nutrients on 25 October put the same parents through two versions of the question, one in words and one in pictures, and compared both with a tape measure and scales.
The work was done between December 2021 and January 2022 in eight kindergartens in Pudong, Shanghai, with researchers from Shanghai Jiao Tong University School of Medicine. Child health staff measured 520 children aged three to six, average age just under five, and the parent who handled their daily meals filled in a questionnaire; three in four were mothers. Using the WHO's BMI-for-age charts, 89 children (about 18%) had overweight or obesity, almost all the rest were in the normal range, and only one was underweight. These were mostly well-off, well-educated families: 86% of parents had been to college.
In words, parents chose from five labels running from "markedly underweight" to "markedly overweight". In pictures, they saw seven age- and sex-matched drawings of children, from very thin to heavy, each tied to a point on the BMI growth charts, and picked the one most like their child. Among the 88 children with excess weight whose parents answered the picture question, 72 parents chose a normal-weight drawing, five chose an underweight one, and only 11 chose one of the two heavier figures. That is 87.5% underestimating. Asked in words, 50 of the 89 parents did call their child overweight, and 43% underestimated.
The underestimation ran the other way too. Around 36% of parents of normal-weight children described or pictured them as underweight, by either method, which matters because worry about a child being too thin often comes with pushing them to eat more. Overall, the words matched the measurements only fairly (weighted kappa 0.37), and the pictures did worse (0.21); counted strictly category by category, the picture answers agreed with the measurements no better than chance.
The authors suggest the two questions tap different things. Saying "overweight" out loud carries stigma, but in China it may be softened by the old idea that a chubby child is a healthy, well-fed one. Choosing a picture is a quicker, gut-level judgement, and when heavier children are common, eyes recalibrate: a heavier body starts to look ordinary. That second idea, called visual normalisation, would explain why the drawings missed so much excess weight.
Did misjudging change how parents fed their children? Parents who verbally underestimated their child's weight scored a little lower on limiting which foods the child ate and on setting rules around eating, but the differences were small and disappeared once the researchers corrected for testing twelve links at once. Picture-based underestimation showed no consistent link with feeding at all. This was a single snapshot from one district, using parents' own reports of their feeding habits, so it shows patterns rather than causes. The practical point is narrower and still useful: the way a doctor or nurse asks about a child's weight changes the answer they get, and a growth chart is a better guide than either a parent's word or their eye.
Parental Misperception of Preschool Children's Weight Status in China: Verbal Versus Visual Assessment and Associations with Feeding Practices (Nutrients, 2026)
520
Parent and child pairs from eight kindergartens in Pudong, Shanghai, children aged 3 to 6, measured December 2021 to January 2022
89 (17.6%)
Children with overweight or obesity by WHO BMI-for-age (z-score above +1)
87.5%
Parents of those children who picked a slimmer drawing than their child's actual category (77 of 88)
43.2%
Parents of those children who underestimated when asked in words (38 of 88)
~36%
Parents of normal-weight children who saw them as underweight, in words or pictures
0.37 vs 0.21
Agreement with measured weight status (weighted kappa) for words versus pictures; 1 would be perfect
Cross-sectional questionnaire study with measured height and weight. Weight status from WHO BMI-for-age z-scores (WHO Anthro and AnthroPlus): underweight below −2, normal −2 to +1, overweight/obesity above +1, used for all ages in this study (for under-fives the WHO calls +1 to +2 'at risk of overweight'). Verbal item from the Chinese Child Feeding Questionnaire; visual item from the Warschburger and Kröller age- and sex-specific silhouettes (seven figures, 3rd to 97th BMI percentile). Denominators vary with missing answers (n = 504 verbal, 498 visual). Underestimation was more common with pictures overall (45.1% vs 37.8%, McNemar p < 0.001) and among children with excess weight (87.5% vs 43.2%, p < 0.001), not among normal-weight children (36.0% vs 36.8%). Feeding links: verbal underestimation, β −0.16 for content-restricted and −0.13 for behaviour-restricted feeding on 1–5 scales (p = 0.043 and 0.038), both BH-adjusted p = 0.203. Convenience sample of mostly high-income, college-educated families in one district. Figures from the open-access article (CC BY 4.0), Tables 1 to 5.
- Between 1990 and 2022, obesity among children and teenagers in China rose from 1.3% to 15.2% in boys and from 0.6% to 7.7% in girls, according to the worldwide NCD Risk Factor Collaboration figures the paper cites.
- Of the six feeding habits the parents reported, setting rules about how and when children ate scored highest (4.15 out of 5) and pressuring them to eat scored lowest (2.97).
- A Mexican study comparing words and pictures found something similar: verbal underestimation went with less food restriction, but only for children aged 6 to 12, not those aged 2 to 5.
- The silhouettes used here were first developed in Germany and were reviewed by local child health staff before the study to check they suited Chinese preschoolers.
- Parental Misperception of Preschool Children's Weight Status in China: Verbal Versus Visual Assessment and Associations with Feeding PracticesNutrients (MDPI) · The study, published 25 October 2026 (open access, CC BY 4.0); figures from the abstract, methods, results (Tables 1 to 5), discussion and limitations
- Full textMDPI · Article page with all tables and the forest plot
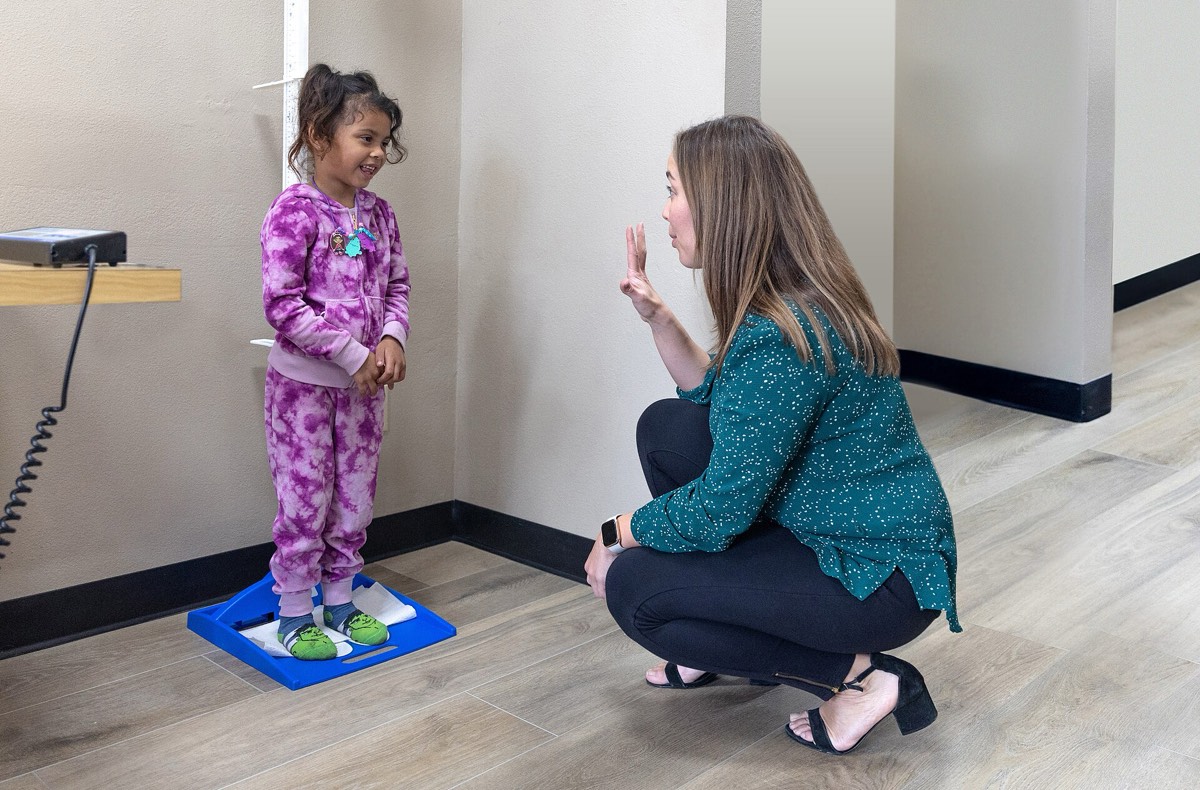
- Child's height measured at a WIC clinic, San DiegoWikimedia Commons · The image, public domain (U.S. Department of Agriculture); an illustration, not a child from the study
General information, not medical advice. This study looked at how parents perceive their child's weight; it can't say whether any child needs to change how they eat. If you're unsure about your child's growth, ask your paediatrician or a registered dietitian to check height and weight against a growth chart, and avoid putting a young child on a diet without professional advice.
Analysis by NutroPractic from the sources listed. Written for general readers; it does not replace advice from your own doctor.
From our articles
Read, then eat a little better
Plain-language guides on nutrition and wellness, backed by research.
Diabetes
Potatoes and blood sugar: boiled, cooled, mashed or fried, and what the cohorts and trials found
Fries were linked to 20% higher diabetes risk per three servings a week in 205,000 US adults; boiled, baked and mashed potatoes to almost none. GI by cooking method, resistant starch in grams after chilling, the glycaemic load of a potato against a cup of rice, and how to fit aloo into an Indian plate.
30 Oct 2026
Children's nutrition
Picky eaters aged 2 to 8: what feeding studies show works at the table
Fussy eating peaks between two and six and is usually a normal stage, not a parenting failure. Feeding trials show what moves it: small repeated tastes, eating together, no pressure and the right kind of reward. Here is how to use them, and the signs that mean it's more than picky eating.
30 Oct 2026
Women's health
PCOS and food: what the diet trials show for cycles, insulin and weight
PCOS affects about one woman in ten, and most are told to "lose weight" with little else. Here is what drives it, why insulin matters even in slim women, how much weight loss brings cycles back, what the low-GI and Mediterranean trials found, what inositol and metformin do, and which tests to ask for.
30 Oct 2026
Newsfeed for your website
Want this feed on your website?
Add it to any site with one copy-and-paste snippet. No sign-up, and it updates itself every hour.
Start with a virtual consultation
Tell Dr. Triveni what you want to change. You will leave with a clear next step, whether you are in Toronto, London, New York or Chennai.