Weight and waistline · November 1, 2026
The scale moved a little, the tape measure a lot: in seven years Mexican waistlines grew almost three times faster than weight alone predicts
Between 2002 and 2009 the average Mexican waist grew by 8.5 cm while body mass index rose only about one point. By the end, seven in ten adults had abdominal obesity but only three in ten counted as obese on BMI. A new analysis of a national survey makes the case for measuring both, and is frank about what its older data cannot tell us.
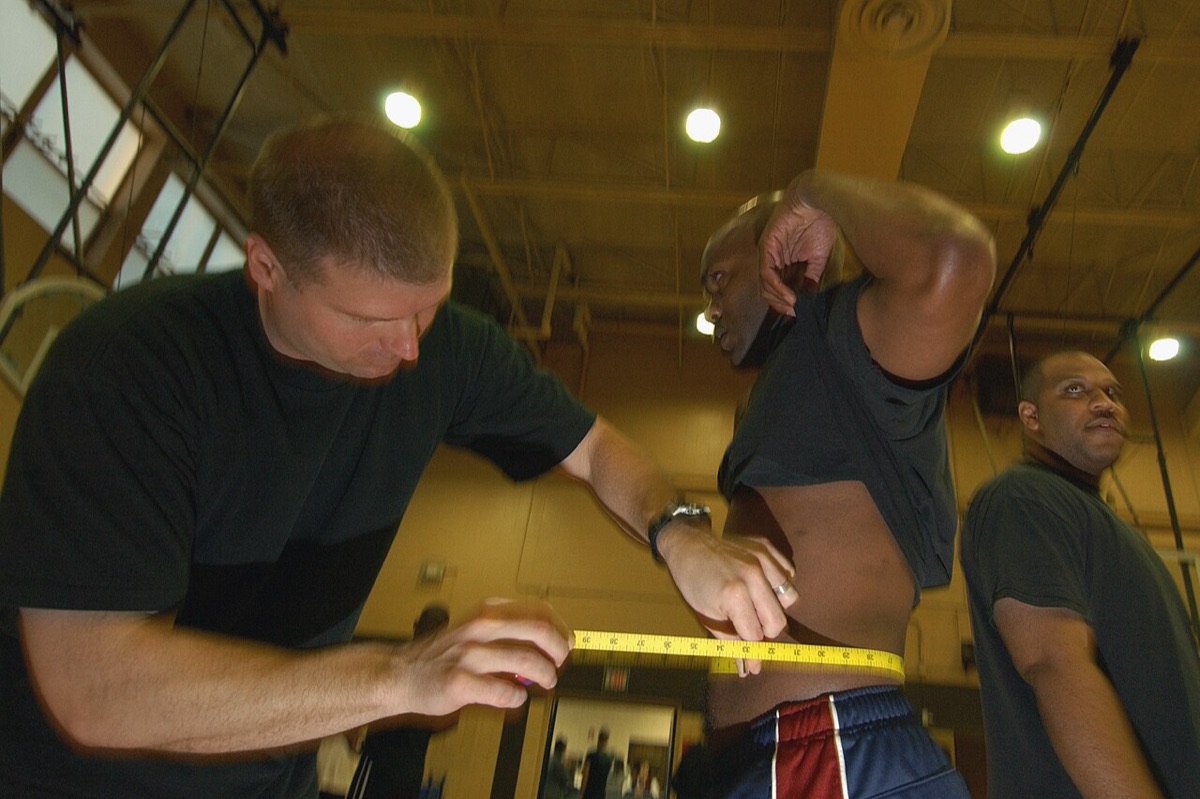
Body mass index is the number most of us know: weight divided by height squared, 30 or more counted as obesity. It is quick and cheap, but it cannot tell where the weight sits, and fat packed around the organs in the belly is the kind most closely tied to insulin resistance, type 2 diabetes and heart disease. A study published on 30 October in Frontiers in Nutrition used one country's survey data to ask how far apart the two pictures, weight and waist, can drift over a few years.
The researchers took three rounds of the Mexican Family Life Survey (ENNVIH), in 2002, 2005 and 2009, in which trained nurses from Mexico's National Institute of Public Health measured weight, height and waist, and people reported whether a doctor had ever diagnosed diabetes or high blood pressure. Because the same people could not be followed reliably from round to round, the team grouped everyone by sex and by age in 2002 (seven age bands from 12 to 74) and tracked these 14 'synthetic cohorts' over time, a method economists call a pseudo-panel. The pooled sample held 86,870 measurements.
Average BMI went from 26.6 to 27.8, a rise of 1.23 points, and the share of people with a BMI of 30 or more went from 24.0% to 30.2%. Waists moved much further: the average grew from 85.2 to 93.7 cm, and the share above the International Diabetes Federation cut-offs used in the study (more than 90 cm for men, 80 cm for women) climbed from 49.1% to 73.0%. Measured against how waist and BMI related to each other in 2002, the waist gain was 2.75 times larger than the BMI gain alone would predict. Over the same years self-reported diabetes rose from 7.4% to 11.4% and high blood pressure from 12.0% to 14.9%. The gap was sharpest in the oldest groups: people who were 55 to 74 in 2002 saw almost no change in BMI, yet their waists still grew by 4.7 cm on average.
The study has real limits, and the authors spell them out. The data stop in 2009, before Mexico's 2014 tax on sugary drinks, its 2020 warning labels on packaged food and the disruption of COVID-19, so the paper's straight-line projections to 2025 are illustrative only, not forecasts. The 2009 round could not be weighted to match the national population. Diabetes and blood pressure were self-reported, so undiagnosed cases are missed. Results describe groups, not individuals, and with only 14 cohorts the BMI rise became borderline in a stricter statistical check, while the waist rise held firm. What survives all of that is a simple point many clinicians already argue for: a tape measure catches a change that the bathroom scale and BMI can hide, especially in middle and later life.
The cardiometabolic transition in Mexico: cohort-level evidence from the ENNVIH, 2002 to 2009 (Frontiers in Nutrition, 30 October 2026)
86,870
Survey measurements pooled from 2002, 2005 and 2009, grouped into 14 cohorts by sex and age
+8.5 cm
Rise in average waist, 85.2 to 93.7 cm, 2002 to 2009
+1.23
Rise in average BMI, 26.6 to 27.8, over the same years
2.75x
How much faster waists grew than the BMI change alone would predict
49% to 73%
Share with abdominal obesity (waist over 90 cm men, 80 cm women)
24% to 30%
Share with obesity by BMI (30 or more)
7.4% to 11.4%
Self-reported diabetes, 2002 to 2009
+4.7 cm
Waist gain in people aged 55 to 74 in 2002, whose BMI barely changed
Cohort-level averages from repeated national surveys, not the same individuals measured three times, so the study describes population change and cannot say what caused it. Waist and weight were measured by nurses; diabetes and high blood pressure were self-reported. The 2009 round is unweighted. The data end in 2009; the paper's projections to 2025 ignore later policies and COVID-19 and are illustrative only.
- Waist cut-offs differ by guideline and by ethnic group. The 90 cm (men) and 80 cm (women) limits used in this study are the International Diabetes Federation's values for South and Central American and South Asian adults; its European values are 94 cm and 80 cm.
- Mexico put a tax of one peso per litre on sugar-sweetened drinks in 2014 and added black octagon warning labels to packaged foods in October 2020, both after the last survey round analysed here.
- The pseudo-panel trick, following groups born in the same years through repeated surveys instead of following the same people, was formalised by the economist Angus Deaton in 1985.
- Ageing alone can push the two measures apart: muscle tends to shrink and fat tends to move towards the belly in later life, so weight can hold steady while the waist grows.
- The cardiometabolic transition in Mexico: cohort-level evidence from the ENNVIH, 2002-2009Frontiers in Nutrition, 30 October 2026 · Open-access original research (CC BY): methods, Tables 1 and 2 with the waist, BMI, diabetes and blood pressure changes, and the limitations.
- Full text on the journal siteFrontiers · Section 3.5 has the age-group results; section 4.4 explains why the 2025 projections are not forecasts.
- Waist circumference as a vital sign in clinical practice: a Consensus Statement from the IAS and ICCR Working Group on Visceral ObesityNature Reviews Endocrinology, 2020 · The expert statement arguing that waist should be measured alongside BMI in routine care.
- Waist measurement photographWikimedia Commons · US Air Force photograph in the public domain, used as a general illustration.
General information, not medical advice. This study described changes in population averages in Mexico between 2002 and 2009; it did not test any diet or treatment. If you are concerned about your weight, waist size, blood sugar or blood pressure, talk to your doctor or a registered dietitian.
Analysis by NutroPractic from the sources listed. Written for general readers; it does not replace advice from your own doctor.
From our articles
Read, then eat a little better
Plain-language guides on nutrition and wellness, backed by research.
Diabetes
Potatoes and blood sugar: boiled, cooled, mashed or fried, and what the cohorts and trials found
Fries were linked to 20% higher diabetes risk per three servings a week in 205,000 US adults; boiled, baked and mashed potatoes to almost none. GI by cooking method, resistant starch in grams after chilling, the glycaemic load of a potato against a cup of rice, and how to fit aloo into an Indian plate.
30 Oct 2026

Children's nutrition
Picky eaters aged 2 to 8: what feeding studies show works at the table
Fussy eating peaks between two and six and is usually a normal stage, not a parenting failure. Feeding trials show what moves it: small repeated tastes, eating together, no pressure and the right kind of reward. Here is how to use them, and the signs that mean it's more than picky eating.
30 Oct 2026

Women's health
PCOS and food: what the diet trials show for cycles, insulin and weight
PCOS affects about one woman in ten, and most are told to "lose weight" with little else. Here is what drives it, why insulin matters even in slim women, how much weight loss brings cycles back, what the low-GI and Mediterranean trials found, what inositol and metformin do, and which tests to ask for.
30 Oct 2026
Newsfeed for your website
Want this feed on your website?
Add it to any site with one copy-and-paste snippet. No sign-up, and it updates itself every hour.
Start with a virtual consultation
Tell Dr. Triveni what you want to change. You will leave with a clear next step, whether you are in Toronto, London, New York or Chennai.