Sugar and drinks · October 30, 2026
Four in five students in a Leicester study drank sugary drinks, a third got a tenth of their energy from free sugars. Their body fat didn't give it away
Researchers went back to food diaries and body scans from 111 students at an English university in 2016, before the UK's sugar tax. They sorted every one of 441 food and drink entries by hand to find out exactly where the sugar came from. The sources were clear. The link with body fat was not, and the authors are careful about what that means.
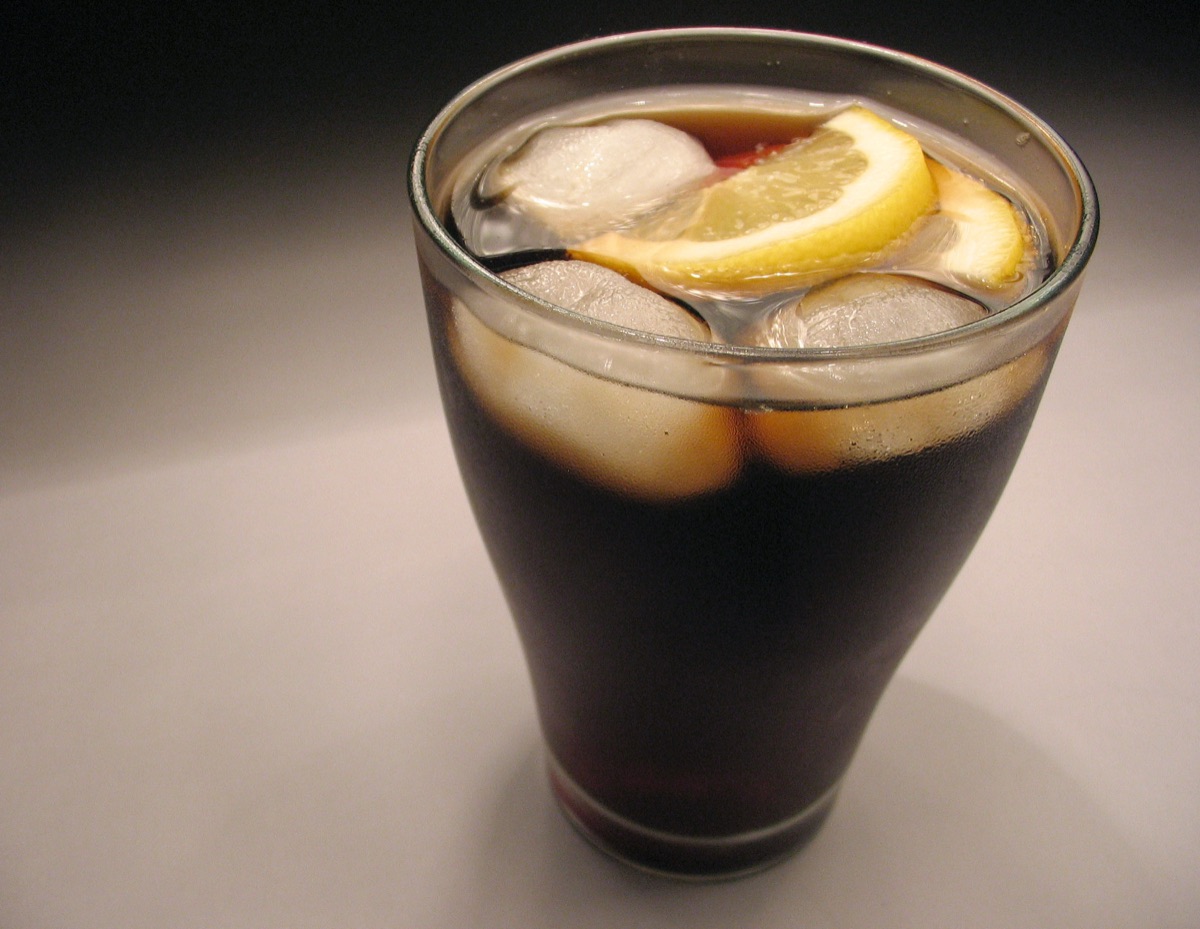
Most of what we know about sugar and weight in young adults comes from broad categories. A survey box marked 'soft drinks' can hold a regular cola, a diet cola and a sports drink, which makes the answers hard to read. A study published in Nutrients on 28 October, from researchers at De Montfort University in Leicester and the University of Alcalá in Spain, tried to be more precise about where the sugar was actually coming from.
The data are not new. In January to mid-March 2016 the team assessed 111 students aged 18 to 22 at De Montfort University. Seven in ten were women, and the group was unusually mixed: 37% were born in Africa, 37% in Asia and 24% in Europe. Each filled in a food-frequency questionnaire covering the previous four weeks, adapted from the one used in the long-running EPIC-Norfolk study, and had their height measured by a nurse and their weight and body fat measured on a bioimpedance scale after an overnight fast.
For this analysis the researchers went back to the raw records and checked all 441 food and drink names one by one. Regular soft drinks, squash and cordials, sports drinks, energy drinks and sweetened fruit drinks counted as sugar-sweetened drinks. Diet and zero-sugar versions did not, and neither did 100% fruit juice, which was tracked separately even though its sugars count as free sugars under UK and WHO definitions. Three drinks whose recipe in 2016 couldn't be pinned down were left out and tested separately.
The median student got 43.2 g of free sugars a day, 8.2% of their energy. A third (33.3%) were at or above 10%, the WHO's upper limit, and fewer than one in five (18.9%) were below 5%, the stricter UK target. Four in five (81.1%) drank sugar-sweetened drinks, a median of 159 g a day by weight, about half a standard can. Regular soft drinks and cola made up 62.3% of all of it, squash and cordials 19.4%, sports drinks 9.3%, energy drinks 5.6% and sweetened fruit drinks 3.3%. Most students (83.8%) also drank some 100% juice.
Then the question everyone wants answered: did the students with more sugar carry more fat? None of the six main comparisons found a clear link with BMI, body fat or the scale's visceral fat score, after allowing for age, sex, birthplace and total calories. The authors are explicit that this is not evidence of no effect. Each 5-point rise in free sugars' share of energy went with 0.5 points more body fat, but the range of plausible values ran from 0.7 points less to 1.7 points more. With 109 people in the models, the study couldn't rule a meaningful effect in or out.
There are other reasons for caution. It is a one-off snapshot, so it can't show cause and effect. Food-frequency questionnaires rely on memory, and this expanded version was not re-checked against a reference method. The students were young and mostly lean (average BMI 23.7), and visceral fat scores ranged only from 1 to 9, all inside the device's normal range, which leaves little room to see differences. The authors also stress the date: the UK's Soft Drinks Industry Levy arrived in April 2018 and pushed manufacturers to cut sugar from many drinks, so these figures describe what students drank before that change, not what they drink now.
Free sugars and source-resolved sugar-sweetened beverage consumption in geographically diverse young adults at an English university (2015-2016): associations with adiposity and body composition (Nutrients, 2026)
111
Students aged 18 to 22 at De Montfort University, Leicester, assessed January to March 2016; 70.3% women; mean age 20.4
43.2 g
Median free sugars a day, 8.2% of energy (IQR 5.4% to 12.3%); range 0.6% to 43.3%
33.3%
Got 10% or more of their energy from free sugars; 47.7% were at 5% to under 10%, 18.9% under 5%
81.1%
Drank sugar-sweetened drinks (median 159 g a day by weight among all students, IQR 45 to 484 g)
62.3%
Share of sugar-sweetened drink intake from regular soft drinks and cola; squash and cordials 19.4%, sports drinks 9.3%, energy drinks 5.6%, sweetened fruit drinks 3.3%
+0.5
Percentage points of body fat per 5-point higher free-sugar share of energy (95% CI -0.7 to +1.7); no clear link with BMI or visceral fat either
Historical cross-sectional analysis of the university arm of a wider study at De Montfort University. Diet by an expanded semi-quantitative food-frequency questionnaire (adapted EPIC-Norfolk, four-week recall) processed in Nutritics; free sugars from Nutritics' own field; sugar-sweetened drinks rebuilt from all 441 food names, excluding diet/no-sugar drinks and 100% juice. Height by stadiometer; weight, body fat and visceral fat rating by Tanita SC-330-S bioimpedance after an 8 h fast. Models adjusted for age, sex, birthplace region and log total energy, with robust (HC3) standard errors; 109 in the adjusted models after two people in a small 'other' birthplace group were left out. For sugar-sweetened drinks, 1 SD more (log scale) went with +0.87 points body fat (95% CI -1.14 to 2.88) and +0.04 BMI (-0.96 to 1.04). False discovery rate q = 0.942 for all six main tests. Drink intake is grams of drink, not grams of sugar.
- Free sugars are not the same as total sugars. They are sugars added by a manufacturer, cook or consumer plus those in honey, syrups and fruit juice; the sugar in milk and inside whole fruit and vegetables doesn't count. In this study median total sugars were 121.7 g a day, free sugars 43.2 g.
- The UK's advice is that free sugars should make up no more than 5% of daily energy, half the WHO's upper limit of 10% (WHO also suggests aiming for under 5%).
- UK government monitoring cited by the authors found a 46% drop in the average sugar content of drinks covered by the Soft Drinks Industry Levy between 2015 and 2020.
- The 100% juice in this study was kept out of the 'sugary drinks' total on purpose. Under UK and WHO definitions its sugars are still free sugars, but it isn't a drink with sugar added, so mixing the two would blur the picture.
- Free Sugars and Source-Resolved Sugar-Sweetened Beverage Consumption in Geographically Diverse Young Adults at an English University (2015-2016): Associations with Adiposity and Body CompositionNutrients (MDPI) · The study, published 28 October 2026 (CC BY); figures from the abstract, methods, results and discussion
- Glass colaWikimedia Commons · The image, public domain
General information, not medical advice. This was a small one-off survey of students in 2016; it can't show whether sugar caused or didn't cause weight or fat gain. If you're concerned about your weight or how much sugar you eat and drink, talk to your doctor or a registered dietitian.
Analysis by NutroPractic from the sources listed. Written for general readers; it does not replace advice from your own doctor.
From our articles
Our guides on this subject
Plain-language guides on nutrition and wellness, backed by research.
Nutrition science
Sweeteners after the WHO advice: aspartame, stevia, erythritol and what the 2023 decisions meant
In 2023 the WHO advised against using sweeteners to control weight, and its cancer agency called aspartame 'possibly carcinogenic' a few weeks later. Neither means your diet drink is dangerous, and neither means it helps. What the reviews found, how much is allowed, why erythritol is the one to watch, and what to do if you have diabetes or simply want less sugar.
18 Oct 2026
Diabetes
Potatoes and blood sugar: boiled, cooled, mashed or fried, and what the cohorts and trials found
Fries were linked to 20% higher diabetes risk per three servings a week in 205,000 US adults; boiled, baked and mashed potatoes to almost none. GI by cooking method, resistant starch in grams after chilling, the glycaemic load of a potato against a cup of rice, and how to fit aloo into an Indian plate.
30 Oct 2026
Children's nutrition
Picky eaters aged 2 to 8: what feeding studies show works at the table
Fussy eating peaks between two and six and is usually a normal stage, not a parenting failure. Feeding trials show what moves it: small repeated tastes, eating together, no pressure and the right kind of reward. Here is how to use them, and the signs that mean it's more than picky eating.
30 Oct 2026
Newsfeed for your website
Want this feed on your website?
Add it to any site with one copy-and-paste snippet. No sign-up, and it updates itself every hour.
Start with a virtual consultation
Tell Dr. Triveni what you want to change. You will leave with a clear next step, whether you are in Toronto, London, New York or Chennai.