Food security · November 5, 2026
Erase food insecurity in a model and poorer older Americans gain the most. The main reason looks like head count: 40.8% of them went short, against 2.4% of the best-off
Researchers followed 6,695 US adults for years and asked who would feel better if nobody lacked money for food. The answer seems obvious until you ask why, and the study only checked people's food situation once.
In 2013 a mailed questionnaire asked American adults, most of them over 50, some blunt things. Did the food run out before there was money to buy more? Did you cut or skip meals because there wasn't enough money? Were you ever hungry and didn't eat? A new analysis in Frontiers in Nutrition, published on 3 November, took 6,695 people who answered and followed their reports of depressive symptoms through 2020. It's hardly news that money, hunger and low mood travel together. The authors wanted to pull apart something harder. If poorer people stand to gain more from food security, is that because more of them lack it, or because going without hurts them more?
The head count comes first. The team scored each person on wealth, income and education, then split them into three groups of similar size. Food insecurity, meaning two or more points on the six-point US government short form, touched 40.8% of the low group, 14.2% of the middle group and 2.4% of the high group. Very low food security, the more severe band, was 18.2% against 1.2%. By our calculation, 69% of all the food-insecure people in the study (869 of 1,262) sat in the low group.
Those people also reported more symptoms. After adjusting for earlier symptoms, age, sex, race and ethnicity, smoking, alcohol, BMI, health and insurance, food insecurity went with a score 0.286 standard deviations worse in 2014. Using the spread in the paper's baseline table, we make that about half a point on an eight-item yes-or-no symptom checklist. That checklist isn't a diagnosis. The gap then shrank by 0.065 per two-year wave, which by our arithmetic leaves about 0.09 by 2020. It would be pleasant to read this as recovery, but the authors warn against it: food security was measured only once. Someone who went hungry in 2013 might be fine by 2018, so part of the fading may just be a label going out of date. The study also can't separate brief hardship from years of it.
The headline number comes from a simulation. Nobody was given food. The researchers used a statistical model to predict everyone's scores with food insecurity switched off, then compared that with what was observed. Averaged over the follow-up, the gain was 0.097 standard deviations in the low group (95% CI 0.068 to 0.126), 0.023 in the middle group and 0.003 in the high group, whose interval includes zero. On the checklist, 0.097 is roughly a fifth of a point by our conversion, spread across a whole group that includes the many people who already had enough to eat. The authors say plainly that this isn't the expected effect of any particular programme, whether cash, vouchers or food boxes, and that those options are not interchangeable.
So is it exposure or vulnerability? The authors went in expecting vulnerability: people with less of a cushion would be hit harder. The evidence for that was thin. A second measure, which compares everyone food-secure with everyone food-insecure, favoured a larger gap in the low group over the high group in 2014 (a difference of 0.288, 95% CI 0.057 to 0.519), and that difference wasn't significant at later waves, though a joint test across all four waves did signal variation (P = 0.024). A separate test of how the gap changed over time singled out middle against high (P = 0.016), but low against high didn't reach significance (P = 0.185), so there was no neat ladder from poor to rich. Their conclusion is that the bigger benefit mainly reflects the bigger burden. Our own crude check supports 'mainly' without making it 'entirely'. Prevalence was 2.9 times higher in the low group than the middle one, while the modelled gain was 4.2 times higher. That is a back-of-envelope ratio and not a finding of the paper, and the high group contributes only 51 food-insecure people, so it can't carry much weight.
Direction is the other open question. Depression can make it harder to work, shop, cook and manage money, so it can produce food problems as well as follow them. Adjusting for 2012 symptoms helps but doesn't settle that, and the authors say so. The people dropped for missing data were older, poorer and in worse health, and the results carry no national weighting, so they describe this sample more than older Americans at large. With those limits in mind, the practical point is a modest one. If the gain in a group comes mainly from how many people are affected, then how many people a food programme reaches matters, whatever anyone's personal resilience turns out to be.
Food insecurity and psychological health: the numbers
6,695
US adults in the analysis, average age 66, from the Health and Retirement Study
40.8% / 14.2% / 2.4%
Food insecure in 2013, by low, middle and high socioeconomic group
−0.286 SD
Adjusted gap in psychological health in 2014, food insecure v food secure; 95% CI −0.336 to −0.235
+0.065 SD
Narrowing of that gap every two years (95% CI 0.044 to 0.085); food security was not re-measured
0.097 SD
Modelled gain with no food insecurity, low group, averaged over 2014–2020; 95% CI 0.068 to 0.126
0.023 SD
Same estimate, middle group; 95% CI 0.011 to 0.035
0.003 SD
Same estimate, high group; 95% CI −0.002 to 0.007, includes no effect
0.288 SD
Low v high group difference in the food-security contrast, 2014 only; 95% CI 0.057 to 0.519; not significant at later waves
Observational study; the gains are model-based estimates that rely on assumptions the authors list, and they can't exclude unmeasured confounding or reverse causation. Food security was measured once (2013), symptoms by self-report on an eight-item scale in 2012 and from 2014 to 2020. Findings aren't nationally weighted. Conversions to checklist points (using the baseline SD of 1.9), the 69% share, the 2020 gap of about 0.09 and the 2.9 and 4.2 ratios are our own arithmetic from the paper's figures. Supplementary tables not read. Funding for this analysis came from Shaanxi provincial programmes in China; the authors declared no commercial conflicts.
- The short form has five numbered questions on paper but scores out of six, because the cut-or-skip-meals item counts twice: once for doing it, once for how often.
- USDA describes its six-item form as a reasonably reliable substitute for surveys that can't run the 10-item or 18-item versions. It uses a subset of the standard 18 questions.
- 'Low' here is relative. Wealth and income were split into three bands within the study sample itself, so the low group is not defined by any official poverty line.
- Of 12,418 questionnaires mailed, 8,073 came back (65%), and 1,378 of those were then dropped for missing data. Food insecurity was almost the same among those dropped and those kept: 18.9% against 18.8%.
- Having a partner differed sharply by group: 85.6% of the high group against 46.4% of the low group. Drinking alcohol ran the same way, 73.2% against 41.4%.
- One odd row in the baseline table: 'no health insurance' is listed for 45.9% of the high group and 31.1% of the low group, in a sample averaging 66 years old. The paper doesn't comment on it, and we would treat that row with care.
- Socioeconomic differences of psychological health and the potential benefit of eliminating food insecurity: longitudinal and counterfactual evidence from the health and retirement studyFrontiers in Nutrition, 3 November 2026 · Open-access paper (CC BY); methods, Tables 1 and 2, results, limitations and funding checked against the full text. Figures and supplementary tables not read beyond the numbers stated in the text.
- Survey Tools: Food Security in the U.S.USDA Economic Research Service · Describes the six-item short form and its relation to the longer modules.
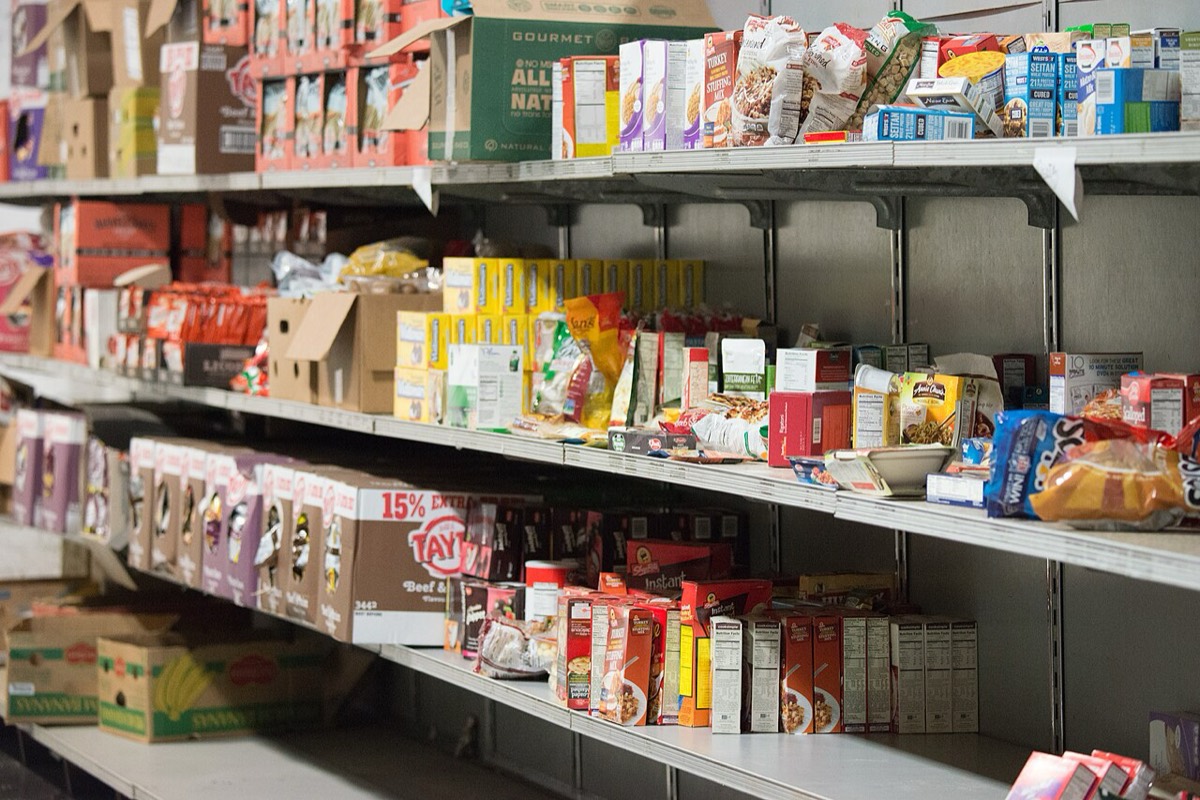
- USDA Foods - Community FoodBank of New Jersey (20160120-FNS-LSC-0428).jpgWikimedia Commons · US Department of Agriculture photograph, public domain; reused as a general illustration.
General information, not medical advice. This study describes associations and modelled estimates in one group of mostly older US adults. If low mood persists, or you are skipping meals because of money, tell your doctor or a local food-assistance service. If you feel unsafe, contact your local emergency number or crisis line straight away.
Analysis by NutroPractic from the sources listed. Written for general readers; it does not replace advice from your own doctor.
From our articles
Our guides on this subject
Plain-language guides on nutrition and wellness, backed by research.
Everyday eating
Eating well on a tight food budget: what the cost studies found, and the cheapest protein and fibre per dollar
Healthier diets cost about $1.48 a person a day more, according to a meta-analysis of 27 studies. What the USDA's Thrifty Food Plan costs in 2026, our price check of protein and fibre per dollar at September 2026 prices, why frozen and tinned vegetables are not second best, and a batch-cooked stew at $1.40 a serving.
20 Oct 2026
Diabetes
Pasta and blood sugar: al dente, cooled and reheated, and what the glucose tests measured
Head-to-head tests found little gap between 5 and 15 minutes of boiling. Chilling and reheating ranged from no change to a large drop. Moving from 80 g to 150 g adds 50 g of carbs. The tests, the sums, and legume and whole-wheat pastas per 100 g.
4 Nov 2026
Lifestyle
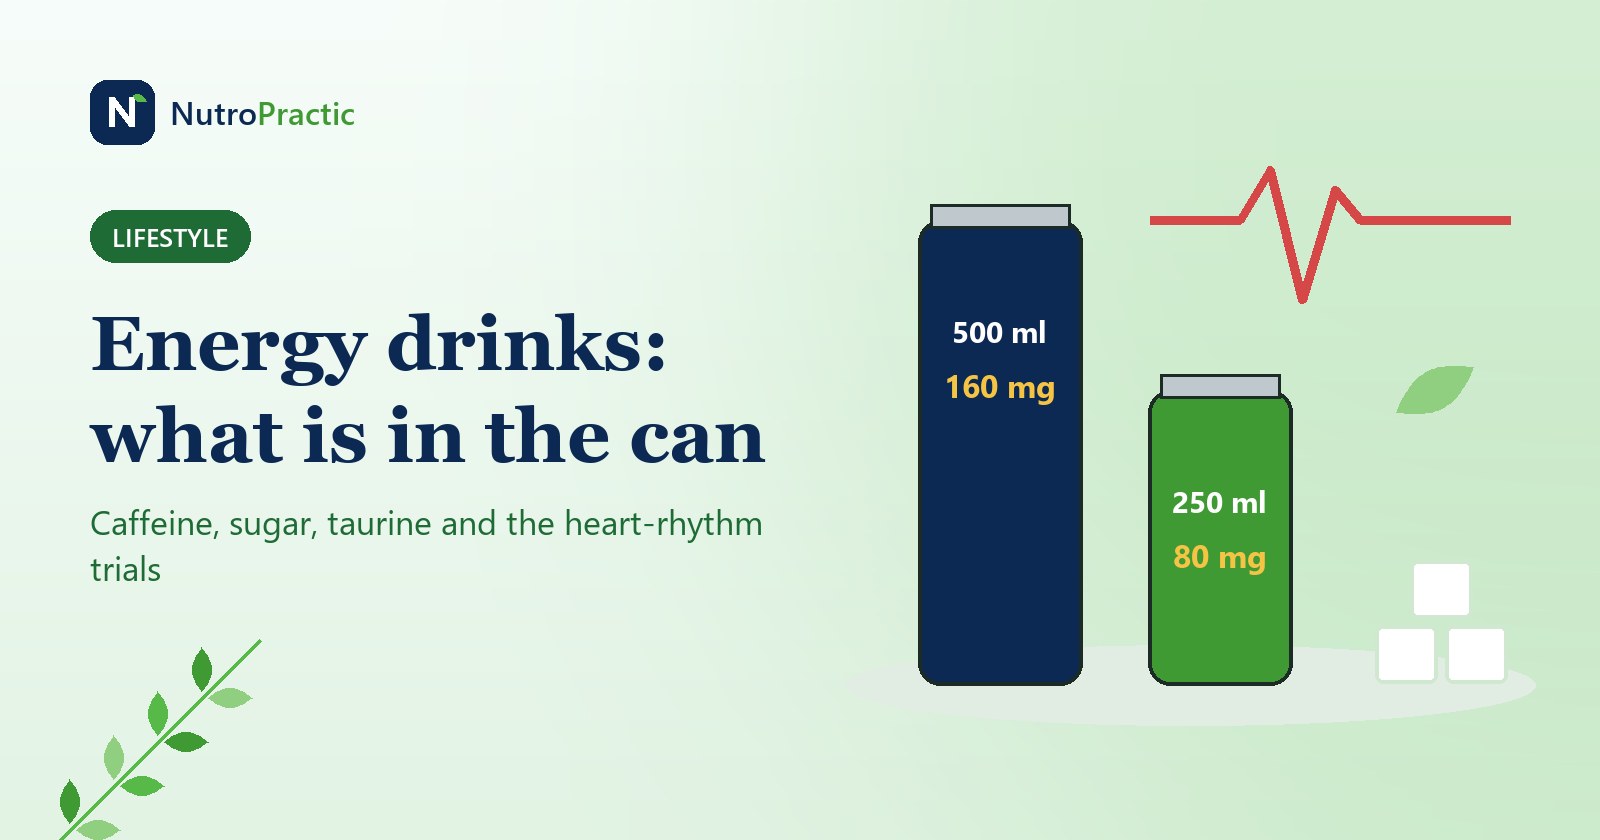
Energy drinks: caffeine, sugar and taurine per can, and what the emergency-visit and heart-rhythm studies found
From 80 mg to 300 mg of caffeine, and up to 55 g of sugar in one can. The numbers by brand, what they mean for a 50 kg teenager, what the QT and blood pressure trials measured, the old emergency-visit data and England's coming under-16 ban.
4 Nov 2026
Newsfeed for your website
Want this feed on your website?
Add it to any site with one copy-and-paste snippet. No sign-up, and it updates itself every hour.
Start with a virtual consultation
Tell Dr. Triveni what you want to change. You will leave with a clear next step, whether you are in Toronto, London, New York or Chennai.