Weight and diet quality · November 5, 2026
A five-point diet-quality rise tracked with 19% lower obesity risk. The curve's most useful part was at the bottom, not the top
Researchers followed 1,527 adults in Hubei for a median 14 years, repeatedly measuring three days of food. Better scores went with fewer new obesity cases — but the result was observational, and the benefit flattened at higher scores.
A diet score can hide a practical question: does moving from poor to middling eating matter as much as polishing an already strong diet? A prospective study published on 30 October 2026 found that the answer may not be a straight line. Among adults in Hubei Province, China, the association between diet quality and new obesity was steepest at the lower end of the score and nearly flat at the higher end.
The researchers used the China Health and Nutrition Survey to follow 1,527 adults aged 20 or older who did not have obesity when they entered the analysis. Participants had taken part in at least two survey waves between 1991 and 2023. At each wave, they recalled everything eaten over three consecutive days while their household's food was weighed over the same period. The team calculated the Chinese Healthy Eating Index, then averaged each person's available scores over time rather than treating one food diary as a permanent identity.
Over 23,193 person-years — a median follow-up of 14 years — 159 people developed obesity. Each five-point increase in the cumulative average diet score was associated with a 19% lower hazard after adjustment for demographic, lifestyle and health factors: hazard ratio 0.81, with a 95% confidence interval from 0.68 to 0.96.
That 19% is a relative comparison, not a promise that improving a score prevents one obesity case in five. The study observed what people ate; it did not assign diets. People with higher scores may differ in income, activity, health awareness or other details that statistical adjustment cannot completely recover. Diet and body measurements were repeated, which is stronger than a one-time survey, but the design still cannot prove cause and effect.
The curve is the more interesting finding. It was L-shaped rather than a steady diagonal, with a statistical test supporting non-linearity (p = 0.029). Risk fell more sharply across the poorer-quality range and changed little once scores were higher. That argues against perfectionism: the data suggest the largest potential gain sits in repairing a weak pattern, not chasing the final few points on a checklist.
Two components stood out when considered separately. A one-standard-deviation increase in the score for whole grains and mixed beans was associated with a 31% lower hazard, while the dark-vegetable component was associated with a 22% lower hazard. When the components were adjusted for one another, only whole grains and mixed beans remained statistically robust, at a 27% lower hazard. This does not turn either food group into an anti-obesity treatment; component scores can also stand in for a wider pattern of eating and living.
The index was designed around Chinese dietary guidance, and the participants came from one province. The exact points and foods should not be exported as a universal prescription. The transferable lesson is gentler: repeated snapshots of an overall diet can tell us more than one 'good' or 'bad' meal, and the first realistic improvements may matter more than an immaculate score. For weight concerns, a clinician or dietitian can help translate that principle into food that fits a person's culture, health and budget.
Repeated diet records, 159 new obesity cases
1,527
Adults without obesity at baseline in Hubei Province
14 years
Median follow-up across survey waves from 1991 to 2023
159
Participants who developed obesity during follow-up
HR 0.81
Adjusted hazard per five-point higher cumulative diet score; 95% CI 0.68–0.96
p = 0.029
Test for the L-shaped, non-linear association
HR 0.73
Whole-grain and mixed-bean component per SD after mutual component adjustment; 95% CI 0.59–0.91
Prospective observational cohort using cumulative-average Chinese Healthy Eating Index scores. Each survey wave combined three consecutive 24-hour recalls with household food weighing. Hazard ratios describe associations after adjustment; they do not establish that changing the score caused the difference in obesity incidence.
- The analysis used cumulative averages, so later diet measurements updated a participant's long-term score instead of leaving the baseline diary to represent decades.
- The 1,527 participants contributed 23,193 person-years of observation.
- An L-shaped association means the slope was steep at low scores and then flattened; it does not identify a universal threshold for a 'safe' diet.
- Whole grains and mixed beans were scored together as one index component, so this analysis cannot separate their individual contributions.
- Dark vegetables showed an association when components were examined separately, but it was no longer statistically robust when the diet components were mutually adjusted.
- The study excluded people who already had obesity at baseline, so its question was incidence, not weight loss or obesity treatment.
- Chinese Healthy Eating Index and Incident Obesity: A Prospective Cohort Study with Repeated Dietary AssessmentsFrontiers in Nutrition, 30 October 2026 · Primary open-access study; abstract checked for the cohort, repeated dietary assessment, follow-up, case count, hazard ratios, non-linear curve and component analysis.
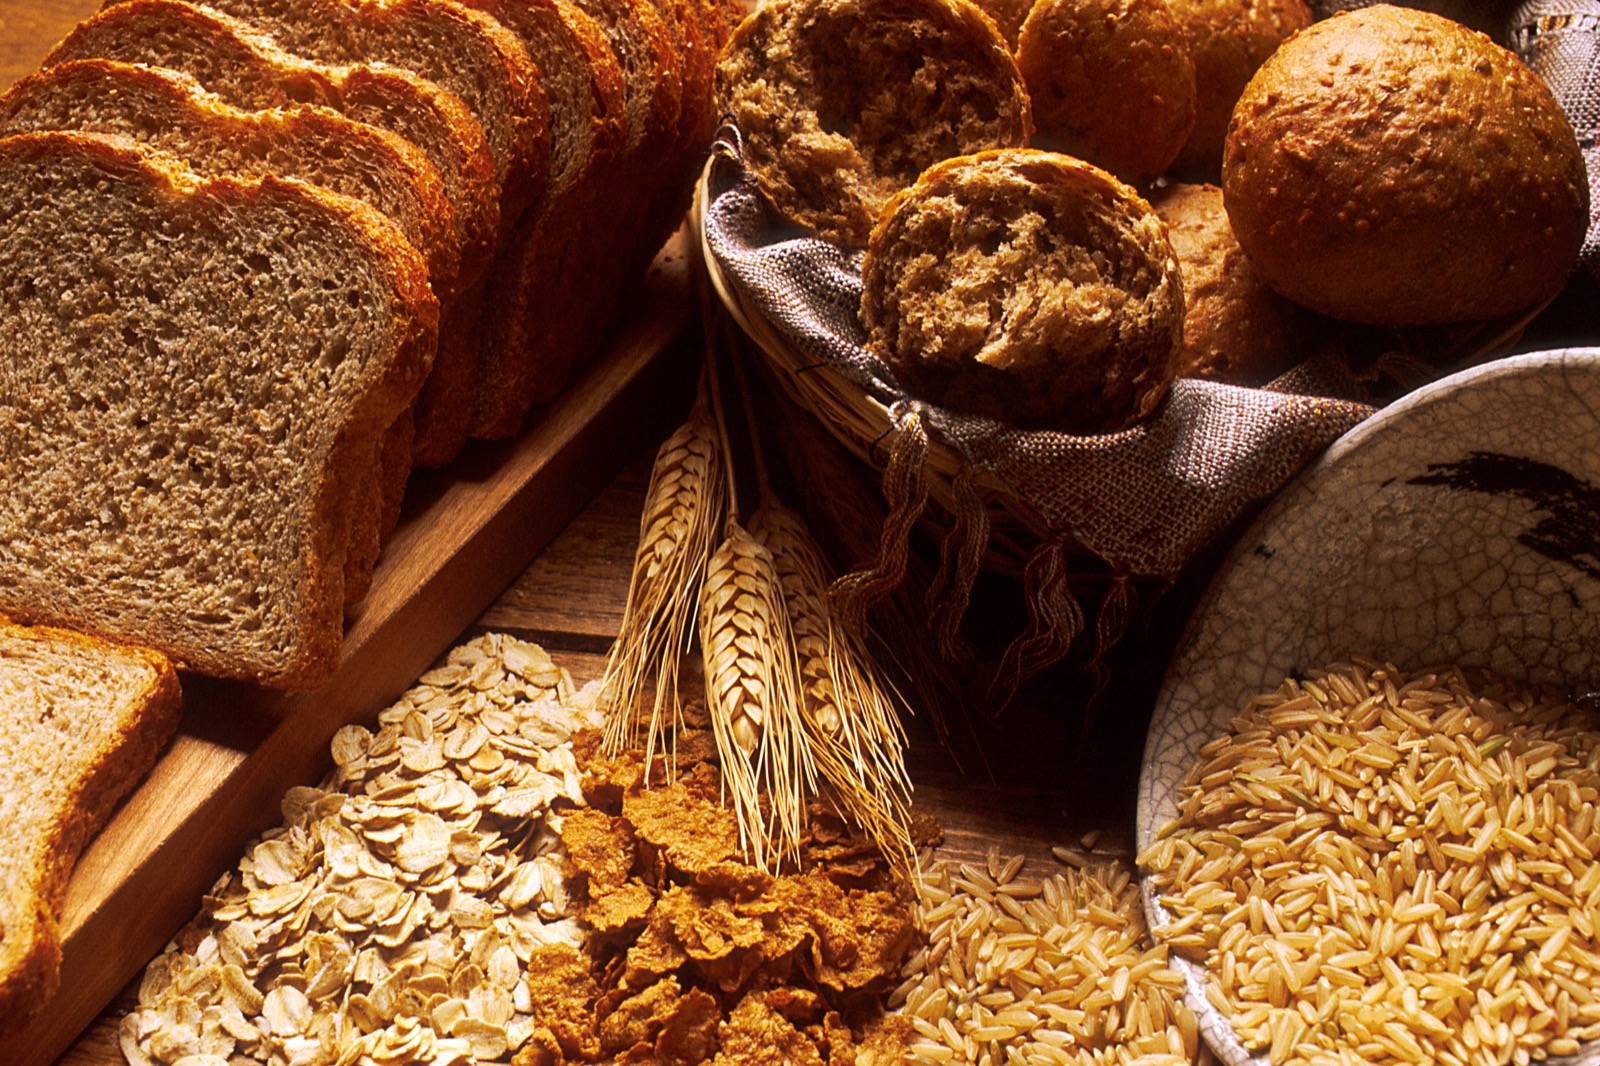
- Bread and grainsWikimedia Commons · US National Cancer Institute photograph, public domain as a US federal government work; reused as a general grain illustration.
General information, not medical advice. This observational study found associations and cannot prove that raising a diet score prevents obesity. The index and results come from adults in one Chinese province and are not a personal meal plan. For weight, diabetes or other health concerns, speak with a qualified clinician or dietitian.
Analysis by NutroPractic from the sources listed. Written for general readers; it does not replace advice from your own doctor.
From our articles
Read, then eat a little better
Plain-language guides on nutrition and wellness, backed by research.
Diabetes
Pasta and blood sugar: al dente, cooled and reheated, and what the glucose tests measured
Head-to-head tests found little gap between 5 and 15 minutes of boiling. Chilling and reheating ranged from no change to a large drop. Moving from 80 g to 150 g adds 50 g of carbs. The tests, the sums, and legume and whole-wheat pastas per 100 g.
4 Nov 2026
Lifestyle
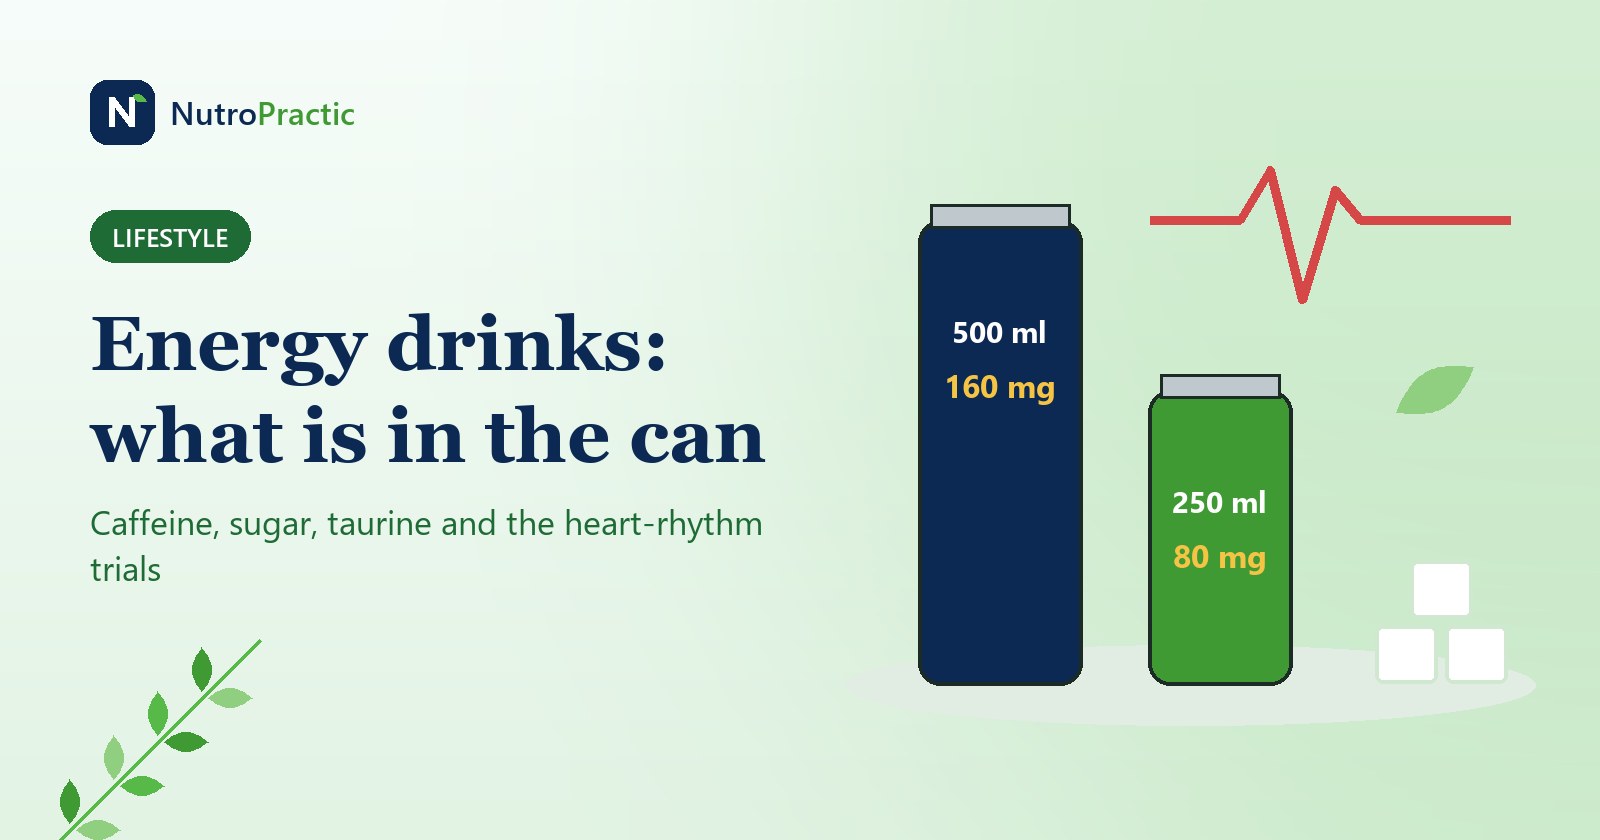
Energy drinks: caffeine, sugar and taurine per can, and what the emergency-visit and heart-rhythm studies found
From 80 mg to 300 mg of caffeine, and up to 55 g of sugar in one can. The numbers by brand, what they mean for a 50 kg teenager, what the QT and blood pressure trials measured, the old emergency-visit data and England's coming under-16 ban.
4 Nov 2026
Everyday eating
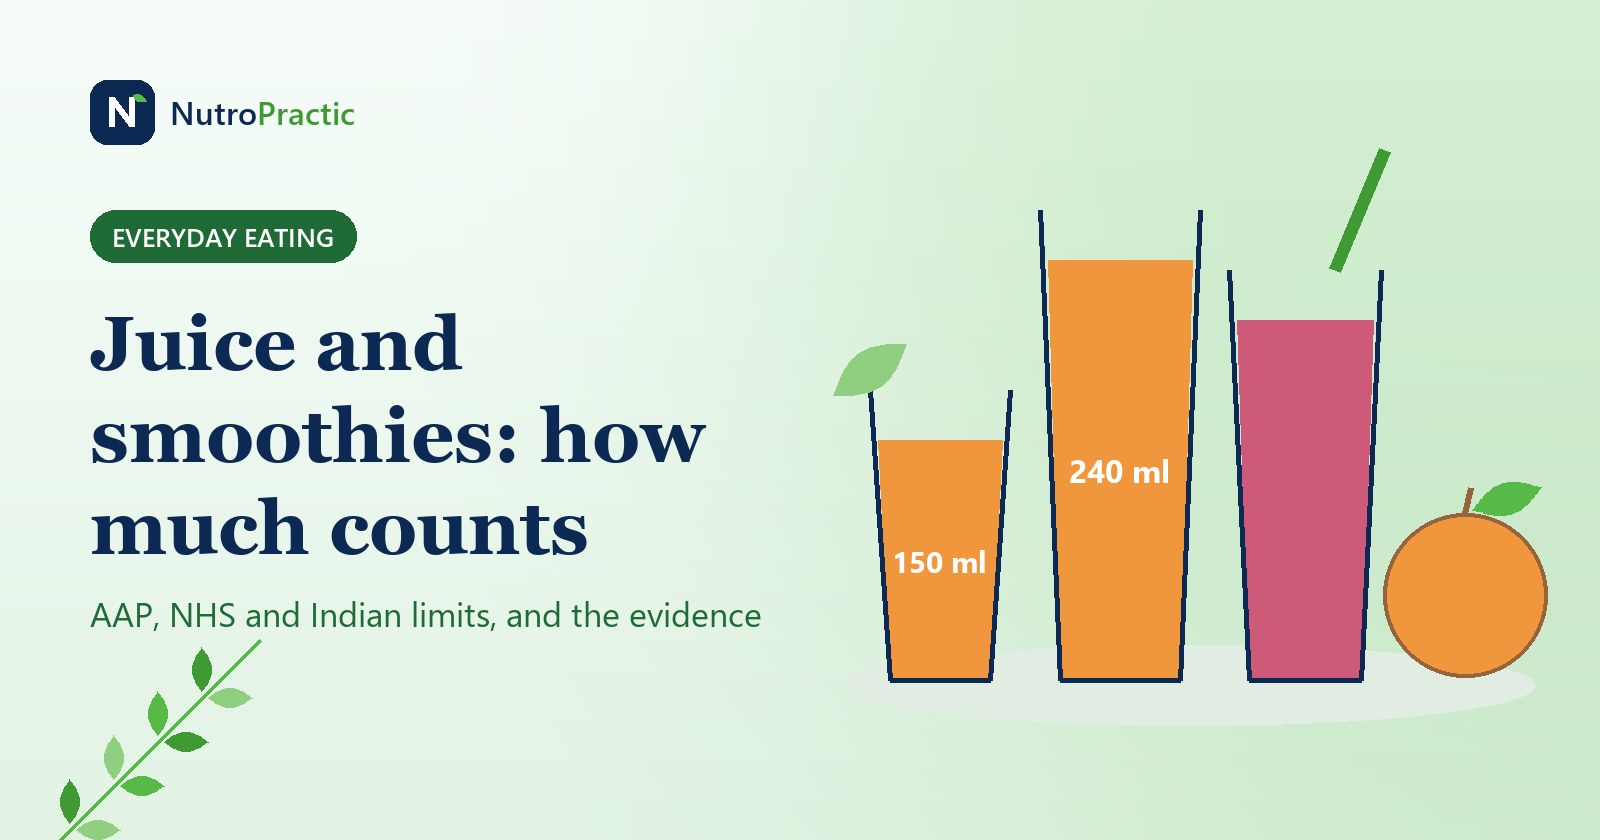
Fruit juice and smoothies for children and adults: how much counts, and what the AAP and NHS limits are based on
None under 1, 120 ml at 1 to 3, 150 ml for British adults, 250 ml for older Indian children. The limits side by side, sugar per glass against whole fruit, what the cohort studies on weight and diabetes found, and why smoothies are a closer call.
3 Nov 2026
Newsfeed for your website
Want this feed on your website?
Add it to any site with one copy-and-paste snippet. No sign-up, and it updates itself every hour.
Start with a virtual consultation
Tell Dr. Triveni what you want to change. You will leave with a clear next step, whether you are in Toronto, London, New York or Chennai.