Type 1 diabetes · November 5, 2026
Eight lessons on counting carbs added 2.5 hours a day in glucose range. The study had 30 finishers — and no comparison group
Adults with type 1 diabetes spent 73% of the day between 70 and 180 mg/dL after a 12-week dietitian-led course, up from 62.5%. That is a useful signal, but the researchers chose their main outcome after seeing the data.
Carbohydrate counting asks a person using mealtime insulin to estimate the carbohydrate in food and match the dose to it. That sounds like arithmetic, but doing it across home cooking, restaurant portions, labels, snacks and exercise takes more than a conversion table. A study published on 31 October 2026 tested a structured, dietitian-led course in adults with type 1 diabetes who already used continuous glucose monitors.
The programme ran for 12 weeks and had eight visits arranged in three levels. Researchers enrolled 38 adults; 30 completed the follow-up and are the people in the analysis. They compared each finisher's most recent 14 days of sensor readings, HbA1c, insulin dose, weight and food intake with the same measures before the course. There was no usual-care or wait-list group.
Time in range — the share of sensor readings from 70 to 180 mg/dL — rose from an average 62.5% to 73.0%. The mean change was 10.4 percentage points, with a 95% confidence interval from 7.1 to 13.8. Spread over a full day, that is about two and a half extra hours in range. Time above 180 mg/dL fell, while time below range did not increase. HbA1c also moved from 7.71% to 7.08%, a drop of 0.63 percentage points.
The encouraging part is what did not rise. The study detected no increase in body weight or total daily insulin, and the extra time in range did not appear to come from trading high readings for more low ones. Glucose variability, measured by the coefficient of variation, fell from 35.7% to 33.6%. But the group already averaged below the recommended 36% variability threshold at the start, and that change stopped being statistically clear in a sensitivity analysis limited to the 22 people who met the study's body-mass-index eligibility rule.
There are two reasons to treat this as a promising practice result rather than proof. First, everyone received the course. A comparison group is needed to separate the lessons from closer attention, repeated measurement, changes people made on their own or regression towards a better average. Second, the researchers designated time in range as the primary outcome only after data collection and analysis. A primary outcome chosen in advance protects against highlighting whichever measure happens to improve most.
The practical message is not to calculate insulin from an online formula. Carb ratios, correction doses, exercise and low-glucose risk are individual clinical decisions. It is that repeated education with a dietitian may add something even for people who already see their glucose continuously. The next useful test is a larger controlled trial that keeps everyone in the analysis and declares its main sensor outcome before the first participant starts.
Twelve weeks of structured education, measured in sensor time
38 enrolled
Adults with type 1 diabetes using continuous glucose monitoring
30 finished
Participants included in every reported analysis
8 visits
Dietitian-led carbohydrate-counting education across three levels
62.5% to 73.0%
Mean time between 70 and 180 mg/dL before and after the course
+10.4 points
Mean time-in-range change; 95% CI 7.1 to 13.8 points, about 2.5 hours a day
7.71% to 7.08%
Mean HbA1c, with no detected rise in weight or daily insulin dose
35.7% to 33.6%
Glucose coefficient of variation; the sensitivity analysis in 22 eligible participants was not significant
Single-arm pre–post study with completers only. Sensor metrics came from 14-day periods at baseline and week 12. The authors designated time in range as the primary outcome after data collection and analysis, so it was post hoc. Without a control group, the study cannot establish that the course caused the changes.
- A 10.4-percentage-point rise in time in range equals roughly 150 minutes, or two and a half hours, across a 24-hour day.
- Time in range in this study meant sensor glucose from 70 to 180 mg/dL; personal targets may differ, including during pregnancy or for people at high risk of severe low glucose.
- The percentage of time above both 180 mg/dL and 250 mg/dL fell, while time below range did not increase.
- Eight of the 38 enrolled participants did not complete week 12, so the analysis cannot show what the results would have been if every enrollee were retained.
- HbA1c summarizes average glucose over weeks to months; continuous monitoring also shows when glucose is high, low or rapidly changing.
- The variability result was less robust than the time-in-range result: it disappeared in the smaller analysis restricted to participants meeting the BMI eligibility criterion.
- Beyond Glycated Hemoglobin: Changes in Time in Range Following Structured Carbohydrate-Counting Education in Adults with Type 1 DiabetesNutrients, 31 October 2026 · Primary open-access study; abstract checked for enrolment and completion, programme length, post-hoc outcome designation, sensor and HbA1c changes, sensitivity analysis and limitations. Licensed CC BY 4.0.
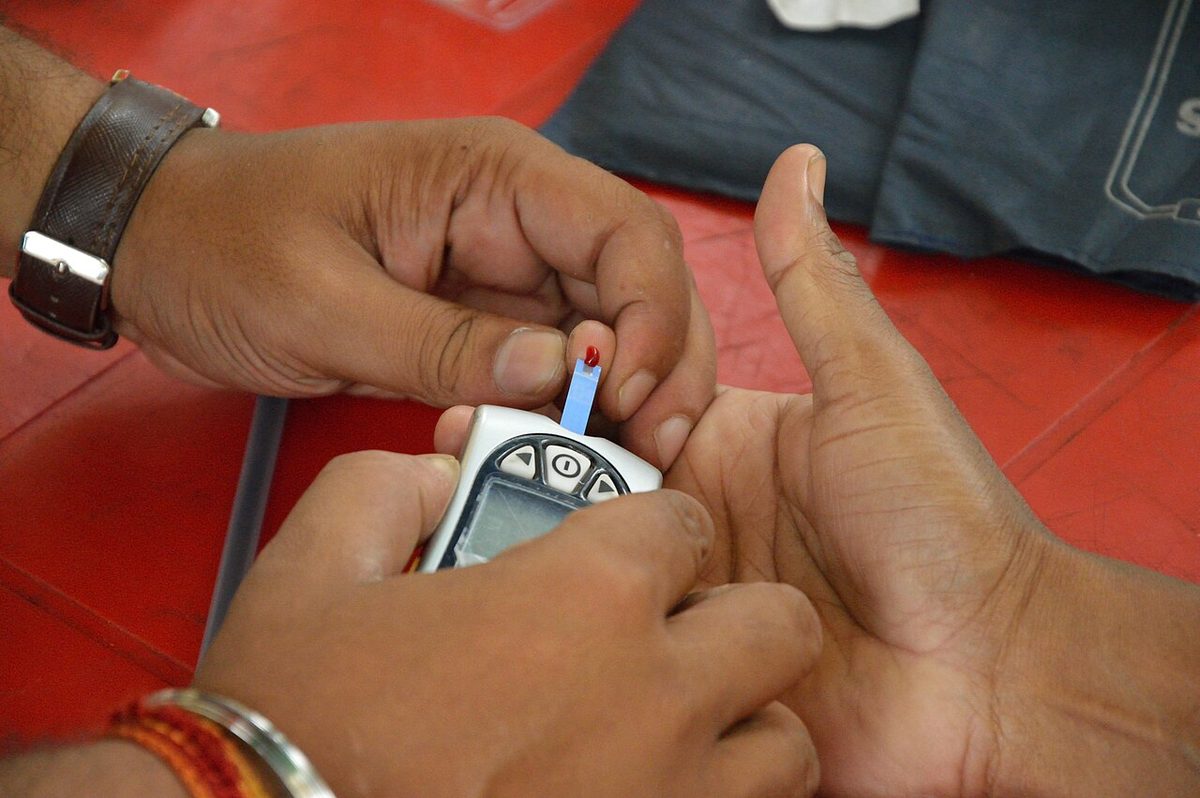
- Blood Glucose Check - Howrah - 2015-04-12 7637Wikimedia Commons · Photograph by Biswarup Ganguly, licensed CC BY 3.0; reused as a general glucose-monitoring illustration.
General information, not medical advice. This small uncontrolled study cannot prove that carbohydrate-counting education caused the glucose changes. Insulin-to-carbohydrate ratios, correction doses and glucose targets must be individualized; do not change insulin based on this report. Work with your diabetes clinician and a qualified dietitian or diabetes educator.
Analysis by NutroPractic from the sources listed. Written for general readers; it does not replace advice from your own doctor.
From our articles
Our guides on this subject
Plain-language guides on nutrition and wellness, backed by research.
Diabetes
Pasta and blood sugar: al dente, cooled and reheated, and what the glucose tests measured
Head-to-head tests found little gap between 5 and 15 minutes of boiling. Chilling and reheating ranged from no change to a large drop. Moving from 80 g to 150 g adds 50 g of carbs. The tests, the sums, and legume and whole-wheat pastas per 100 g.
4 Nov 2026
Diabetes
Fenugreek, cinnamon and turmeric for blood sugar: what the trials in an Indian kitchen measured
Fenugreek seed at 5-10 g a day lowered HbA1c by about 0.85 points in pooled trials, and in a 3-year Hyderabad study 23% went on to diabetes against 55%. Cinnamon trims fasting glucose by 15-25 mg/dL, but a teaspoon of cassia tops the coumarin limit. Curcumin: about 0.3-0.4 points, and rare liver injury from capsules. Doses in teaspoons, and a fair way to test it at home.
1 Nov 2026
Diabetes
Potatoes and blood sugar: boiled, cooled, mashed or fried, and what the cohorts and trials found
Fries were linked to 20% higher diabetes risk per three servings a week in 205,000 US adults; boiled, baked and mashed potatoes to almost none. GI by cooking method, resistant starch in grams after chilling, the glycaemic load of a potato against a cup of rice, and how to fit aloo into an Indian plate.
30 Oct 2026
Newsfeed for your website
Want this feed on your website?
Add it to any site with one copy-and-paste snippet. No sign-up, and it updates itself every hour.
Start with a virtual consultation
Tell Dr. Triveni what you want to change. You will leave with a clear next step, whether you are in Toronto, London, New York or Chennai.