Blood sugar · October 8, 2026
The snack that moved blood sugar most wasn't the sweet one: in 785 adults wearing glucose sensors, bread and buns topped the list, and a brisk hour afterwards pulled it back down
For nine ordinary days, adults in Singapore without diabetes wore a glucose sensor and an activity tracker and logged every snack on their phones. Bread and buns went with the largest rise in blood sugar afterwards, ahead of fried food, sweets and sugary drinks. Afternoon and early-evening snacks hit harder than morning ones, and moving about after eating went with a smaller rise.
Most advice about blood sugar is built around meals. Snacks get less attention, even though many people eat two or three a day, and they're often eaten on the go, at odd hours, with little thought. A team at the Saw Swee Hock School of Public Health, National University of Singapore, set out to watch what snacks do to blood sugar in real life rather than in a laboratory. Their study was published online in the American Journal of Clinical Nutrition on 7 October 2026.
They followed 785 men and women aged 21 to 69, none with diabetes, for nine days of normal life. Each wore a continuous glucose monitor, a small sensor on the skin that reads glucose every few minutes, and an accelerometer that recorded movement and sleep. Six times a day their phones asked short questions about what they had just eaten or drunk. That produced 3,325 snacking episodes. For each one the researchers measured how far glucose rose above its starting level over the next two hours, a figure called the incremental area under the curve, which averaged 63.8 mmol/l·min. Because every person contributed several snacks, the main comparisons were made within the same person: how their own glucose behaved after one kind of snack compared with another.
Bread or buns went with the largest extra rise, about 31 units more than other snacks, roughly half the average response on top. Deep-fried foods added about 20, sweets about 15 and sugary drinks about 12. Timing mattered too: the same person's glucose rose more after an afternoon snack (about 9 units) or an early-evening one (about 11) than after a morning one. Movement worked the other way. Each hour of moderate to vigorous activity in the two hours after a snack went with about 28 units less, so on the model's straight-line reading, 15 minutes of brisk walking would take off about 7.
There are limits worth knowing. This is an observational study, so it shows patterns rather than proof that bread itself, rather than what came with it, caused the rise. Snacks were self-reported in broad categories, not weighed, so portion size is unknown, and 'bread or buns' covers anything from plain toast to sweet, filled buns. Everyone was free of diabetes, so the rises were the kind a healthy body handles; whether trimming them protects against diabetes later isn't something this study can show. We could only read the paper's summary, so details such as how snacks were defined are taken from it alone. Still, the practical picture is simple and fits earlier work: what a snack is made of, when you have it, and whether you sit still afterwards all shape what it does to your blood sugar, and a starchy snack isn't automatically gentler than a sweet one.
Nine free-living days, 785 adults without diabetes, 3,325 snacks: the extra rise in blood sugar over two hours
63.8
Average two-hour rise in glucose after a snack (incremental area under the curve, mmol/l·min; SD 61.8)
+30.7
Bread or buns (95% CI 20.4 to 41.1), about half the average rise again
+19.8
Deep-fried foods (95% CI 9.2 to 30.4)
+14.6 / +12.2
Sweets (95% CI 6.6 to 22.6) / sugary drinks (95% CI 4.3 to 20.0)
+9.3 / +10.7
Afternoon / early-evening snack compared with a morning one
−28.4
Per hour of moderate to vigorous activity in the two hours after the snack (95% CI −49.2 to −7.5)
From the abstract of the paper in the American Journal of Clinical Nutrition, online 7 October 2026. Figures are within-person differences from linear mixed-effects models, in mmol/l·min of two-hour incremental area under the glucose curve. 'About half the average' compares 30.7 with the 63.8 average and is our arithmetic. Snacks were reported in phone surveys six times a day; glucose came from continuous glucose monitors and activity and sleep from accelerometers. The authors report no competing interests.
- In a 2015 Israeli study, 800 people wore glucose monitors for a week while 46,898 meals were logged, and responses to identical meals varied widely from person to person.
- A 2018 Stanford study found that people judged to have normal blood sugar by standard tests still spent about 15% of the time in the prediabetic range, and 2% in the diabetic range, when monitored continuously.
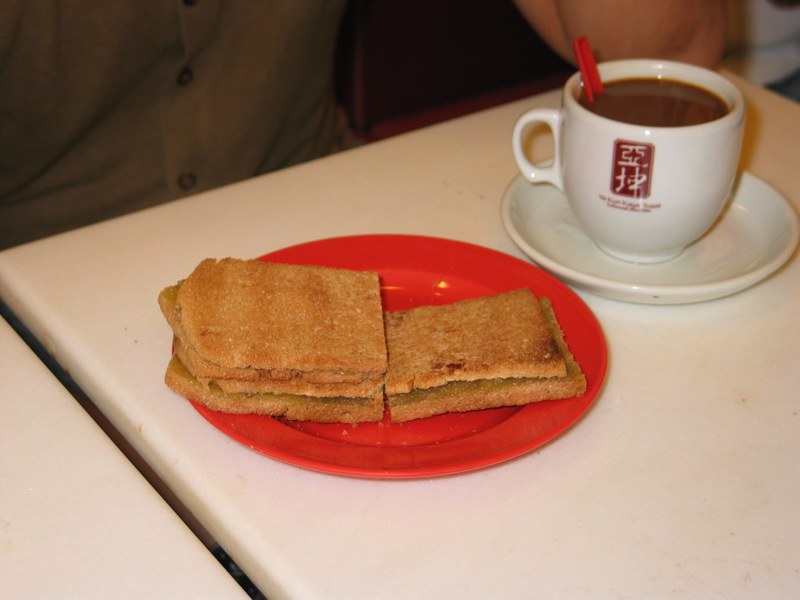
- The toast in the picture is kaya toast, a Singapore breakfast and snack staple: thin toasted bread filled with butter and kaya, a sweet jam made from coconut milk, eggs and sugar.
- The 'incremental area under the curve' adds up how far glucose rises above where it started, minute by minute, so a high, long rise scores more than a short blip.
- Lifestyle determinants of glycemic responses to snacking in free-living adults without diabetes: an intensive longitudinal observational studyAmerican Journal of Clinical Nutrition, online 7 October 2026 · The study; all its figures in this item come from the abstract
- Abstract on PubMed (PMID 42843723)PubMed, US National Library of Medicine · Free abstract with the results and confidence intervals
- Personalized Nutrition by Prediction of Glycemic ResponsesCell, 2015 · 800 people, 46,898 meals, wide variation in responses to identical meals
- Glucotypes reveal new patterns of glucose dysregulationPLOS Biology, 2018 · Prediabetic-range glucose 15% and diabetic-range 2% of the time in people with normal standard tests
- Kaya Toast with Coffee (photo)Daniel., via Wikimedia Commons · CC BY 2.0 image
General information, not medical advice. If you have diabetes or prediabetes, or take medicine that lowers blood sugar, talk to your doctor or a registered dietitian before changing how or when you eat or exercise.
Analysis by NutroPractic from the sources listed. Written for general readers; it does not replace advice from your own doctor.
Newsfeed for your website
Want this feed on your website?
Add it to any site with one copy-and-paste snippet. No sign-up, and it updates itself every hour.
Start with a virtual consultation
Tell Dr. Triveni what you want to change. You will leave with a clear next step, whether you are in Toronto, London, New York or Chennai.