Child health · November 6, 2026
Follow 463,244 Mexican schoolchildren for four school years and the steepest climb in overweight wasn't among the heaviest children. It was in the third of pupils on the path just below them
A single class weigh-in hides who is drifting and who is stable. Linking the same children year after year in one big registry gave four separate paths, and they split by sex, by town and by how well-off the area was.
Most national figures on child weight are snapshots: this year's children against last year's different children. Mexico's national registry of weight and height offered a rarer view. Researchers linked encrypted identity codes across four school years, from 2015–16 to 2018–19, and followed 463,244 children in 17,372 schools, each measured once a year for a total of more than 1.85 million measurements. Nearly nine in ten were 6 to 8 years old at the start.
At that start, 18.4% were classed as overweight, 15.7% as having obesity, 62.0% as normal weight and 3.9% as thin. A statistical model then sorted the children by the path of their BMI-for-age scores, and four groups came out: a low group (13.1% of children), a mid-range group (43.7%), an elevated group (32.0%) and a very-high group (11.2%).
The interesting one is the elevated group. Compared with the low group, the odds of overweight or obesity climbed with each school grade most steeply there, with an interaction odds ratio of 1.33 a grade, against 1.22 for the mid-range group. The very-high group, where overweight was already the norm, went slightly the other way (0.89). In practical terms, the children whose status was changing most sat in that large band below the heaviest, a group a one-off snapshot can't pick out.
The paths also split along social lines, in a direction that may surprise anyone who thinks of child obesity as a problem of poverty alone. In schools in Mexico's most marginalised municipalities, 3.1% of children were on the very-high path and 20.7% on the elevated one. In the least marginalised, the figures were 11.7% and 32.7%. Urban schools had 11.7% on the very-high path, rural schools 7.9%. Indigenous and community-run CONAFE schools had 2.7%, private schools 12.2%. Boys were much more likely than girls to be on the very-high path, at 14.0% against 8.4%.
Those gaps need care. Marginalisation and rural setting describe where a school is, not a particular family's income, and the registry held no information on diet, activity, parents' weight or puberty. The study can't say why any child took any path. Schools joined voluntarily, so the authors say the registry isn't representative of Mexican primary schools, and 84.7% of these children attended schools in the least marginalised municipalities, with only 1% in the most marginalised. Only children with all four yearly measurements counted, and the number left out for that reason couldn't be reconstructed. The groups themselves are model outputs, not natural categories, and the data end in 2019.
Even so, the method has something to teach. Prevalence tells a health ministry how many children are overweight this year. Repeat measurement of the same child shows who is moving, and when, which could help school programmes act before a child's path has settled.
Four paths through primary school
463,244
Children followed across four school years, 2015–16 to 2018–19, in 17,372 schools
34.1%
Overweight or obesity at the start: 18.4% overweight plus 15.7% obesity
32.0%
Children on the elevated path, where the odds of overweight rose most steeply by grade
1.33
Interaction odds ratio per grade for the elevated path, compared with the low path; mid-range was 1.22, very-high 0.89
3.1% v 11.7%
Children on the very-high path in the most v least marginalised municipalities
14.0% v 8.4%
Boys v girls on the very-high path
Retrospective analysis of a voluntary national school registry, so not representative of all Mexican primary schools. BMI scores used the WHO 2007 reference. Group percentages are model estimates. The study reports no diet or activity data and can't show cause. The authors report no external funding and no conflicts of interest.
- A review of 59 studies using this style of trajectory modelling found BMI was the measure most often examined and four the median number of groups. Finding four groups here isn't unusual.
- The registry linked each child through Mexico's unique population code, the CURP, in encrypted and anonymised form, used only to match a child's measurements from year to year.
- 'Marginalisation' here is an index for the municipality around the school. A poor family in a well-off municipality and a better-off family in a poor one would both be classified by where the school stands.
- Weight and height were measured by health and education staff, not reported by parents, which removes one familiar weakness of large surveys, though many different people held the tape.
- Longitudinal BMI-for-Age Trajectories Among Mexican School-Aged Children, 2015–2019Nutrients, 27 October 2026 (CC BY) · Primary study; sample, trajectory shares in Table 2, grade interactions in Table 3 and limitations read in the full text.
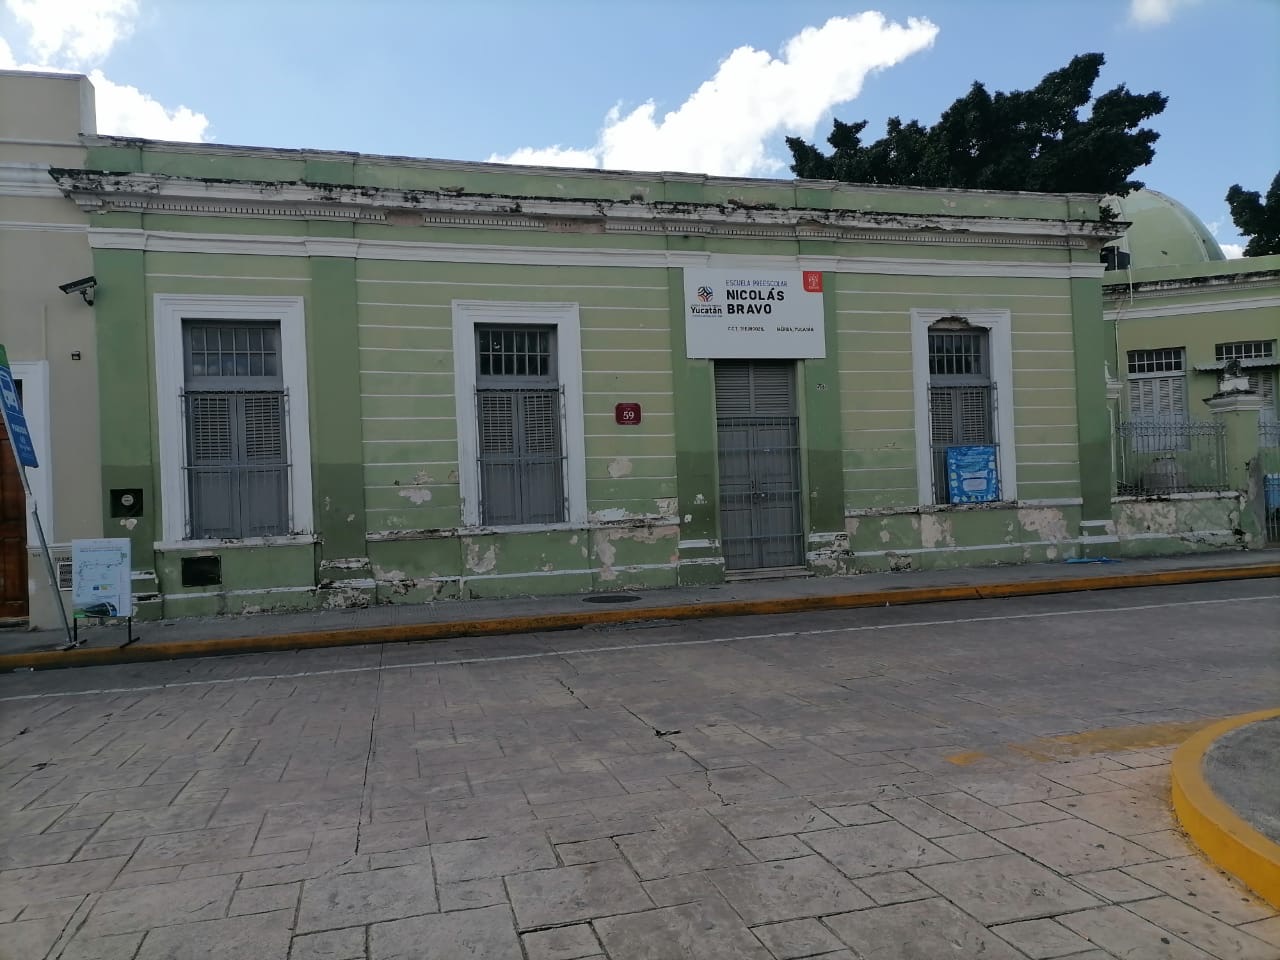
- Escuela primaria Nicolás Bravo, main entranceWikimedia Commons · Photograph by WhosAlei, CC BY 4.0; general illustration only.
General information, not medical advice. These are population patterns in one registry and say nothing about any individual child. Children grow in different ways, and BMI alone can't describe a child's health. If you're concerned about your child's growth, talk to a paediatrician or registered dietitian, and avoid restrictive diets for children without professional advice.
Analysis by NutroPractic from the sources listed. Written for general readers; it does not replace advice from your own doctor.
From our articles
Our guides on this subject
Plain-language guides on nutrition and wellness, backed by research.
Global data
Diabetes, obesity, child malnutrition and hunger, 1980 to 2050: what the numbers show
How diabetes, obesity, child malnutrition and hunger have changed since 1980, with sourced figures and a basic projection to 2050. Click a condition to explore the chart and its facts.
5 Oct 2026
Women's health
Nausea in pregnancy: ginger, vitamin B6, small meals and when it's hyperemesis, from the trials
Only 1.8% of women in one diary study had nausea just in the morning. Ginger at 1 g a day, B6 at 30 to 75 mg and doxylamine with B6 each have trial data, while diet advice has none. The score to track it, the doses, and the signs that mean a phone call.
5 Nov 2026
Diabetes
Vinegar before meals: what the trials measured on blood sugar, and how much is enough
Two teaspoons to a tablespoon with a starchy meal trims the glucose peak at 30 minutes, and the gap fades by two hours. HbA1c reviews range from -0.39 to -1.53, and we explain which to trust. Two gummies hold about 50 mg of acetic acid against 750 mg in a tablespoon.
5 Nov 2026
Newsfeed for your website
Want this feed on your website?
Add it to any site with one copy-and-paste snippet. No sign-up, and it updates itself every hour.
Start with a virtual consultation
Tell Dr. Triveni what you want to change. You will leave with a clear next step, whether you are in Toronto, London, New York or Chennai.