Cardiometabolic health · November 7, 2026
A plant-forward score tracked with 30% lower obesity odds in 33,532 US adults — but it was built from just three nutrients
Higher fibre plus lower saturated fat and cholesterol also tracked with lower diabetes odds, not prediabetes. This cross-sectional proxy was not a record of particular foods.
A repeated cross-sectional analysis pooled US National Health and Nutrition Examination Survey data from 2009–2023. It included 33,532 adults and assigned each a plant-forward score from the average of two 24-hour recalls: fibre counted positively, while saturated fat and cholesterol were reverse-scored.
Compared with the lowest third, the highest-scoring third had an adjusted BMI 1.45 kg/m² lower, 30% lower odds of obesity and 28% lower odds of diabetes. Prediabetes did not show a clear association: adjusted odds ratio 0.92, with a 95% confidence interval from 0.82 to 1.04. Models accounted for demographic, economic, food-security, activity, energy-intake and survey-cycle variables.
The score is best read as a nutrient profile, not proof that a named eating pattern caused the differences. It did not distinguish beans from fibre supplements or describe food processing, and two recalled days may not represent usual intake. People with diabetes may also change their diets after diagnosis. National weighting strengthens population description, but cross-sectional data cannot untangle direction or remove all confounding.
Adjusted associations, not treatment effects
33,532
US adults in NHANES 2009–2023
−1.45 kg/m²
Adjusted BMI difference, highest versus lowest score third; 95% CI −1.82 to −1.09
0.70
Adjusted odds ratio for obesity; 95% CI 0.62–0.79
0.72
Adjusted odds ratio for diabetes; 95% CI 0.62–0.84
0.92
Adjusted odds ratio for prediabetes; 95% CI 0.82–1.04
Repeated cross-sectional survey analysis using a study-specific 0–6 score derived only from fibre, saturated fat and cholesterol. Self-report, reverse causation and residual confounding remain possible.
- Plant-forward does not necessarily mean vegetarian; it describes an emphasis on plant foods.
- NHANES uses examination and laboratory data as well as interviews, then applies survey weights to represent US civilians outside institutions.
- An HbA1c of 5.7% to 6.4% defined prediabetes in this analysis after excluding people classified with diabetes.
- An odds ratio is not the same as a 30% reduction in an individual's future risk.
- Plant-forward dietary patterns and cardiometabolic risk among US adults: findings from the National Health and Nutrition Examination Survey, 2009–2023Preventing Chronic Disease, 5 November 2026 · Primary peer-reviewed report; score construction, sample, outcomes, covariates, estimates and limitations checked against the full article.
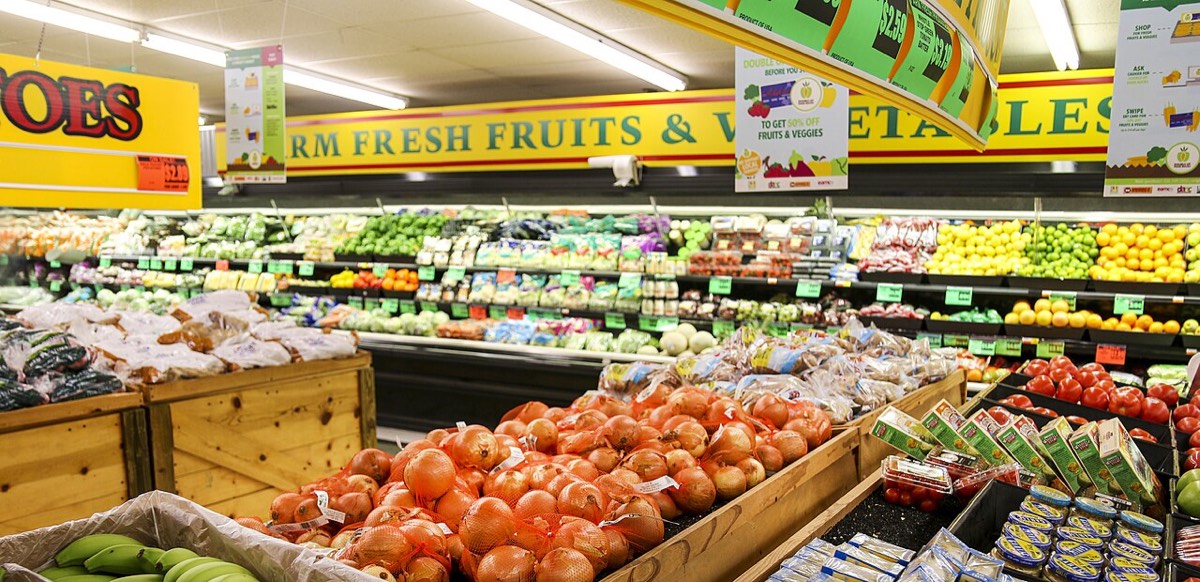
- Fruit section of a grocery storeWikimedia Commons · Photograph by Alabama Extension, CC0; general plant-food illustration only.
General information, not medical advice. This observational score does not prescribe a diet or replace diabetes testing and care. Dietary changes should suit individual medical, cultural and practical needs.
Analysis by NutroPractic from the sources listed. Written for general readers; it does not replace advice from your own doctor.
From our articles
Our guides on this subject
Plain-language guides on nutrition and wellness, backed by research.
Diabetes
Type 2 diabetes remission through weight loss: what the DiRECT trial showed, and who it works for
Almost half of the people in one UK trial put their type 2 diabetes into remission in a year by losing weight. After five years it was 13%. What the trial did, why the amount of weight lost mattered more than the method, who it suits, and how to try it without hurting yourself.
11 Oct 2026
Global data
Diabetes, obesity, child malnutrition and hunger, 1980 to 2050: what the numbers show
How diabetes, obesity, child malnutrition and hunger have changed since 1980, with sourced figures and a basic projection to 2050. Click a condition to explore the chart and its facts.
5 Oct 2026
Everyday eating
Protein bars and shakes: what you get per 100 calories
Four current labels range from 6.3 to 20 g protein per 100 kcal. Here is how bars, shakes, eggs, yogurt and lentils compare—and when a supplement actually helps.
6 Nov 2026
Newsfeed for your website
Want this feed on your website?
Add it to any site with one copy-and-paste snippet. No sign-up, and it updates itself every hour.
Start with a virtual consultation
Tell Dr. Triveni what you want to change. You will leave with a clear next step, whether you are in Toronto, London, New York or Chennai.