Heart health · November 7, 2026
Three routine blood markers formed a heart-failure risk score. In 198 patients, each step up went with 2.6 times the death hazard — but the study came from one hospital
The score combined inflammation, albumin and lymphocytes and separated two-year survival groups neatly. It predicted risk; it did not show that changing any one blood result would change survival.

Could three routine blood results help identify people with heart failure who need closer attention? Researchers reviewed 198 patients with heart failure and reduced ejection fraction at one hospital in Türkiye. They calculated the Osaka Prognostic Score from C-reactive protein, albumin and total lymphocyte count, then followed deaths over two years.
Forty-two patients died, or 21.2%. The median score was 2 among those who died and 0 among survivors. Survival fell step by step across higher score categories, and each additional score point was associated with an adjusted hazard ratio of 2.63 after other variables entered the model.
The score's area under the receiver-operating-characteristic curve was 0.824. That is a measure of how well it separated people who did and did not die in this dataset, not an 82.4% chance that an individual prediction is correct. It performed better than lymphocyte count alone and about as well as C-reactive protein or albumin alone in formal comparisons.
This was a retrospective study from one centre with only 42 deaths, so a model can look better in the patients used to assess it than it will elsewhere. The score also mixes inflammation, nutrition and immune status; it does not tell clinicians which cause produced a high result. Most importantly, prediction is not treatment: raising albumin or changing a blood count has not been shown here to lower risk. The finding is a case for prospective validation, not a home nutrition target.
A promising risk marker that still needs outside testing
198
Patients with heart failure and reduced ejection fraction in the single-centre review
42
Deaths during two years of follow-up, or 21.2%
2 vs 0
Median Osaka score among non-survivors versus survivors
2.63
Adjusted hazard ratio per higher score point; 95% CI 1.86–3.73
0.824
Area under the ROC curve for separating deaths from survivors in this dataset
Retrospective prognostic association, not a trial. A hazard ratio describes relative event rates over follow-up and does not mean 2.63 times as many people died at every score. Performance needs confirmation in independent, larger and more diverse cohorts.
- C-reactive protein rises with inflammation, while albumin can fall with inflammation as well as poor intake, liver disease and fluid shifts.
- Lymphocytes are white blood cells; their count can change with infections, medicines and many illnesses.
- An ROC area of 0.5 is no better than chance for ranking two outcomes, while 1.0 is perfect separation in the tested data.
- Diabetes was also an independent predictor in the model, with an adjusted hazard ratio of 2.67.
- Prognostic value of the Osaka Prognostic Score for two-year mortality in patients with heart failure with reduced ejection fractionFrontiers in Nutrition, 5 November 2026 · Primary open-access study; sample, deaths, adjusted hazard ratios, discrimination and limitations checked against the full article.
- Fresh breakfast served with eggs, sausage, vegetables and toast in a cafeWikimedia Commons · Photograph by Shixart1985, CC BY 2.0; general nutrition illustration only.
General information, not medical advice. This score predicts risk and is not a diagnosis or a nutrition prescription. People with heart failure should not change food, fluid, supplements or medicines without their heart-failure team.
Analysis by NutroPractic from the sources listed. Written for general readers; it does not replace advice from your own doctor.
From our articles
Read, then eat a little better
Plain-language guides on nutrition and wellness, backed by research.
Everyday eating
Protein bars and shakes: what you get per 100 calories
Four current labels range from 6.3 to 20 g protein per 100 kcal. Here is how bars, shakes, eggs, yogurt and lentils compare—and when a supplement actually helps.
6 Nov 2026

Everyday eating
Instant noodles: the sodium in the whole packet, and what actually reduces it
Three official labels range from 750 to 1,520 mg sodium per packet. Here is the whole-pack arithmetic, what the broth study measured, and how to turn noodles into a more complete meal.
6 Nov 2026
Diabetes
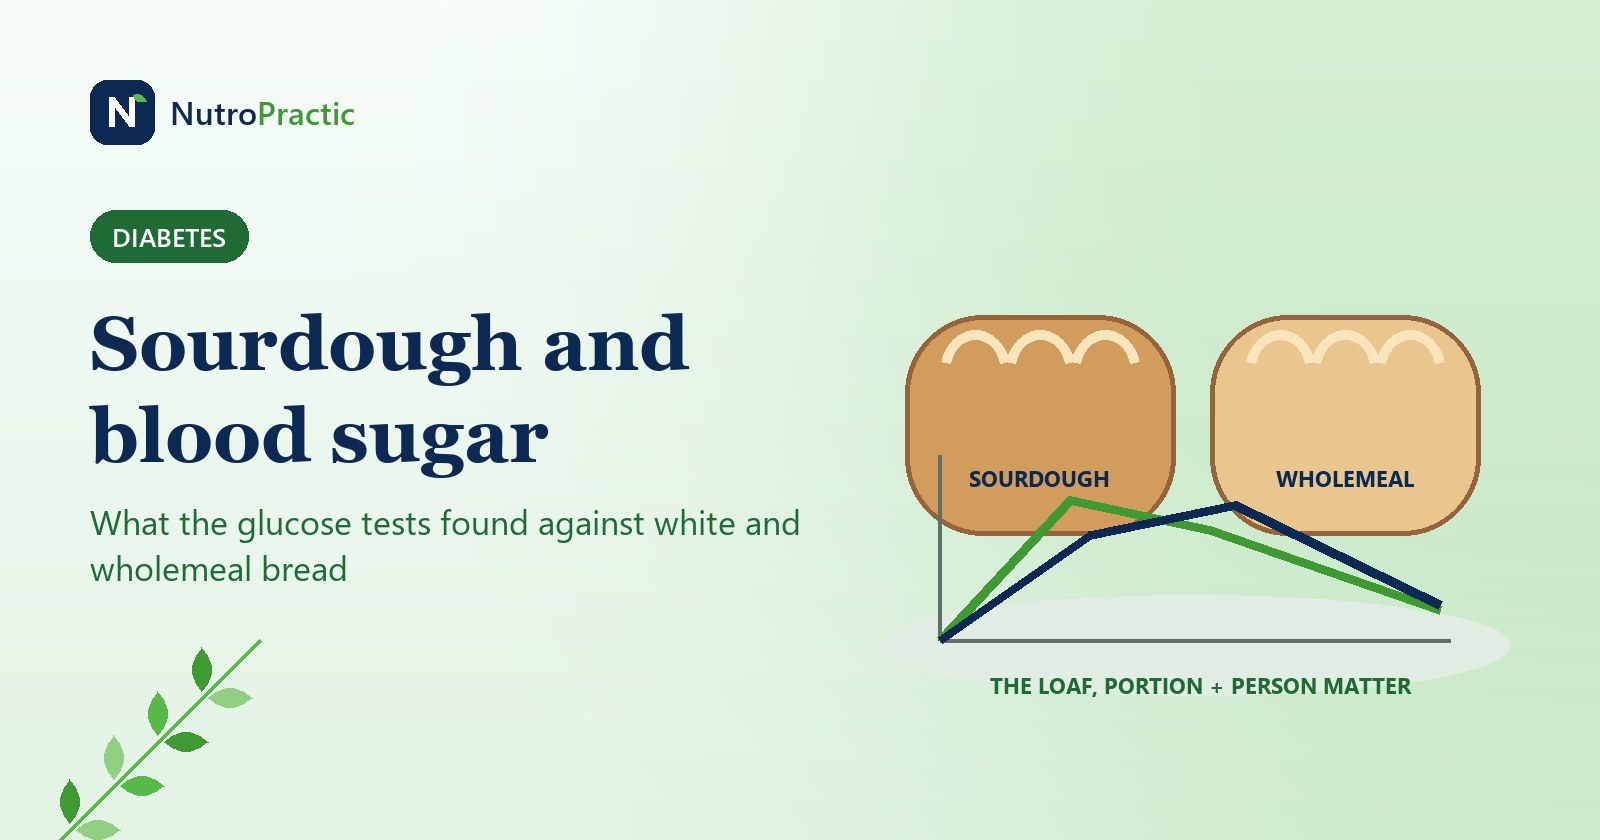
Sourdough and blood sugar: what the glucose tests found against white and wholemeal bread
Sourdough did not beat white bread on average in a 20-person crossover trial, and half responded better to white. A trial-by-trial look at fermentation, flour, portions, GI and how to test your own loaf fairly.
6 Nov 2026
Newsfeed for your website
Want this feed on your website?
Add it to any site with one copy-and-paste snippet. No sign-up, and it updates itself every hour.
Start with a virtual consultation
Tell Dr. Triveni what you want to change. You will leave with a clear next step, whether you are in Toronto, London, New York or Chennai.