Food security · November 7, 2026
A rainfall shortfall barely moved household calories in Malawi. What changed was the plate: nutrient-dense foods lost 0.7 percentage points and staples filled the space
Four survey waves suggest families protected energy intake while fruit, pulses and variety slipped. Spatially robust statistics made the overall evidence imprecise, which is part of the story.
Food-security surveys often ask whether a household obtained enough energy or ate often enough. Researchers asked whether that misses a quieter response to bad weather: keeping calories steady while replacing varied, nutrient-dense foods with staples. They analysed four waves of Malawi's household panel, covering 5,866 household-wave observations in 2010, 2013, 2016 and 2019.
A rainfall deficit of 20 percentage points was not robustly linked with lower energy intake. It was linked with a 0.7-percentage-point fall in the share of energy from nutrient-dense foods, about 4.1% of that share's mean. The staple share rose, and fruit and pulses bore the adjustment while cereals did not.
Households also consumed 0.7 fewer distinct food items, and the share from their own production fell by 1.9 percentage points. Real food expenditure did not rise, suggesting that market purchases did not fully replace what farms lost.
The authors give the uncertainty unusual prominence. The diet-composition measures are different summaries of the same food vector, not independent confirmations. With standard errors that allow nearby places to share the same weather shock, a joint test across four composition measures had p=0.10. The estimated direction was consistent but modest and imprecise. The practical lesson is therefore about measurement: calories alone may miss dietary thinning, while a single significant-looking result can overstate certainty if geography is ignored.
Calories held; variety and nutrient-dense share softened
5,866
Household-wave observations across four Malawi survey rounds
2010–2019
Panel years: 2010, 2013, 2016 and 2019
20 points
Rainfall deficit used for the study's interpretable comparison
−0.7 points
Estimated change in nutrient-dense foods' share of dietary energy
−1.9 points
Estimated change in food obtained from households' own production
p=0.10
Spatially robust joint test across four related diet-composition measures
Longitudinal household analysis using within-household change, not a randomised experiment. The estimates describe household food acquisition and reported consumption under rainfall variation; they do not establish individual nutrient deficiencies or health effects.
- Two diets can contain similar calories while differing greatly in fruit, pulses, vegetables and micronutrients.
- Rainfall shocks can affect neighbouring households together, so treating every location as statistically independent can make estimates look too precise.
- Dietary diversity counts different food groups or items; it does not automatically measure portion size or nutrient absorption.
- A p-value of 0.10 does not prove there was no effect. It means these data did not estimate the combined pattern precisely enough for the conventional 0.05 threshold.
- Beyond calories: rainfall shocks, dietary composition, and the limits of standard food security indicators in MalawiFrontiers in Nutrition, 4 November 2026 · Primary open-access study; panel design, rainfall comparison, diet shifts and spatially robust inference checked against the full text.
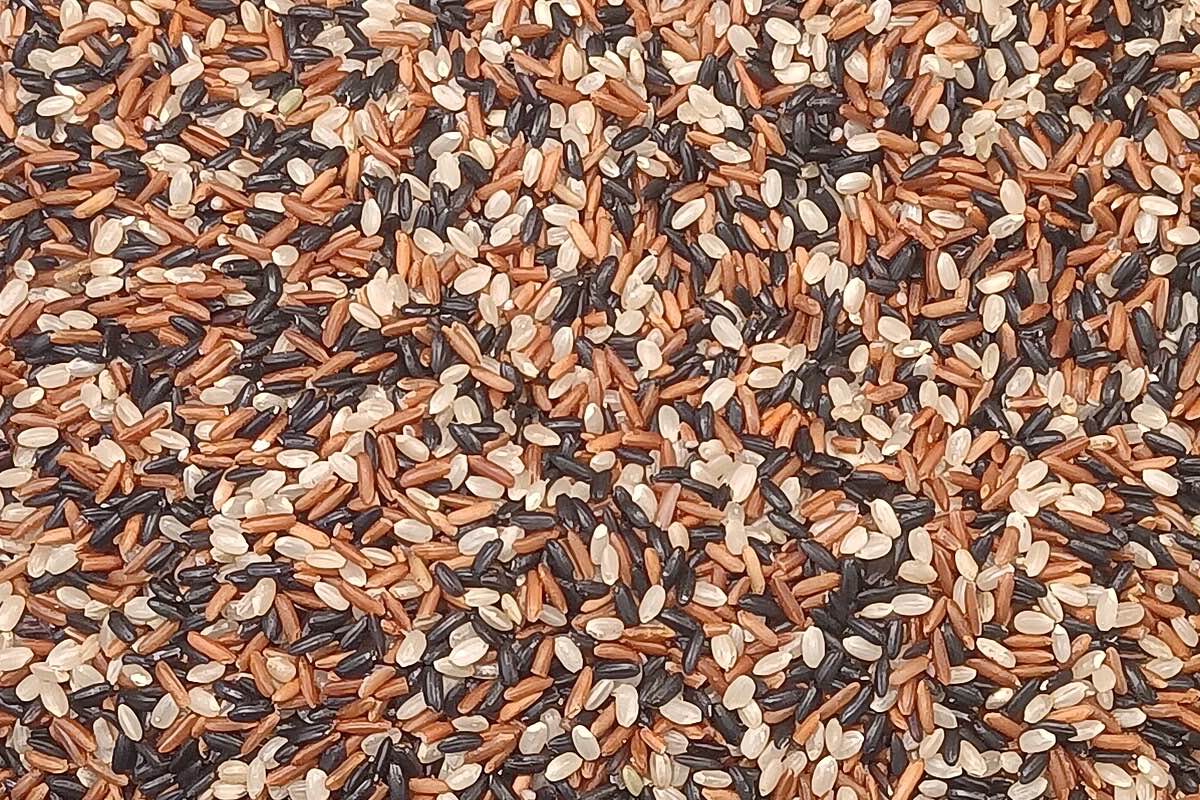
- Tricolor brown riceWikimedia Commons · Photograph by Fumikas Sagisavas, CC0; general staple-grain illustration only.
General information, not medical or aid-programme advice. This household study cannot diagnose nutrient deficiency or predict what any family should eat after a weather shock. Food-security responses should be designed with local communities and qualified public-health teams.
Analysis by NutroPractic from the sources listed. Written for general readers; it does not replace advice from your own doctor.
From our articles
Read, then eat a little better
Plain-language guides on nutrition and wellness, backed by research.
Everyday eating
Protein bars and shakes: what you get per 100 calories
Four current labels range from 6.3 to 20 g protein per 100 kcal. Here is how bars, shakes, eggs, yogurt and lentils compare—and when a supplement actually helps.
6 Nov 2026

Everyday eating
Instant noodles: the sodium in the whole packet, and what actually reduces it
Three official labels range from 750 to 1,520 mg sodium per packet. Here is the whole-pack arithmetic, what the broth study measured, and how to turn noodles into a more complete meal.
6 Nov 2026
Diabetes
Sourdough and blood sugar: what the glucose tests found against white and wholemeal bread
Sourdough did not beat white bread on average in a 20-person crossover trial, and half responded better to white. A trial-by-trial look at fermentation, flour, portions, GI and how to test your own loaf fairly.
6 Nov 2026
Newsfeed for your website
Want this feed on your website?
Add it to any site with one copy-and-paste snippet. No sign-up, and it updates itself every hour.
Start with a virtual consultation
Tell Dr. Triveni what you want to change. You will leave with a clear next step, whether you are in Toronto, London, New York or Chennai.