Everyday nutrition · November 7, 2026
More fruit or vegetables did not line up with lower BMI in a 641-person Saudi survey. The online convenience sample was young, educated and unable to show which came first
Normal-weight adults reported vegetables 88 times a month, while obesity groups reported 70–80 — but the difference could easily be chance. Fruit showed no neat gradient at all.

Does eating fruit and vegetables more often show up as a lower body-mass index in a population where both obesity and low produce intake are common? Researchers distributed an online food-frequency questionnaire through social media and received responses from 641 adults living in Saudi Arabia.
Among the 635 people with usable self-reported height and weight, 43.5% were in the normal BMI range, 29.8% were overweight and 21.7% were in an obesity category. The sample was not a miniature Saudi population: 68.6% were younger than 35 and 78.6% had a bachelor's or postgraduate degree.
Fruit frequency did not differ clearly across BMI groups, with p=0.14. The median was actually highest in the overweight group at 50 times a month, compared with 47 in the normal-weight group, 34 in the underweight group and 40 in obesity class I. Vegetable frequency also missed statistical significance, at p=0.71; normal-weight participants reported a median 88 times a month and obesity groups roughly 70 to 80.
A cross-sectional questionnaire cannot tell whether diet influenced weight, weight influenced what people ate, or both reflected income, health, appetite and reporting habits. Frequency also says nothing about portion size, cooking method or the rest of the diet. Fruit and vegetables remain useful for fibre, micronutrients and dietary variety; this survey simply could not turn how often people reported them into a reliable explanation of BMI.
No clear BMI gradient in a selective online sample
641
Adults in the social-media convenience sample; 635 had usable BMI data
68.6%
Participants younger than 35 years
78.6%
Participants with a bachelor's or postgraduate degree
29.8%
Participants classified as overweight; 21.7% were in obesity categories
p=0.14
Test of fruit-frequency differences across BMI groups
p=0.71
Test of vegetable-frequency differences across BMI groups
Exploratory cross-sectional survey with self-selected participants, self-reported height, weight and food frequency. It can describe this sample but cannot establish that fruit or vegetable intake affects body weight, nor reliably estimate national intake.
- Fifty eating occasions a month averages about 1.6 a day, but an occasion may be a bite, a serving or several servings.
- BMI is a screening ratio of weight to height; it does not directly measure body fat, muscle or metabolic health.
- People often change food choices after gaining weight or receiving health advice, a problem called reverse causation.
- A non-significant difference is not proof that groups are identical; it means the study did not estimate a clear difference.
- Fruit and vegetable consumption and obesity among adults in Saudi Arabia: a cross-sectional studyFrontiers in Nutrition, 4 November 2026 · Primary open-access paper; recruitment, sample profile, BMI categories, consumption frequencies and limitations checked against the full text.
- Fruit section of a grocery storeWikimedia Commons · Photograph by Alabama Extension, CC0; general produce illustration only.
General information, not medical advice. This survey does not show that fruit and vegetables are ineffective for health or weight management. For individual nutrition or weight concerns, speak with a qualified clinician or registered dietitian.
Analysis by NutroPractic from the sources listed. Written for general readers; it does not replace advice from your own doctor.
From our articles
Read, then eat a little better
Plain-language guides on nutrition and wellness, backed by research.
Everyday eating
Protein bars and shakes: what you get per 100 calories
Four current labels range from 6.3 to 20 g protein per 100 kcal. Here is how bars, shakes, eggs, yogurt and lentils compare—and when a supplement actually helps.
6 Nov 2026

Everyday eating
Instant noodles: the sodium in the whole packet, and what actually reduces it
Three official labels range from 750 to 1,520 mg sodium per packet. Here is the whole-pack arithmetic, what the broth study measured, and how to turn noodles into a more complete meal.
6 Nov 2026
Diabetes
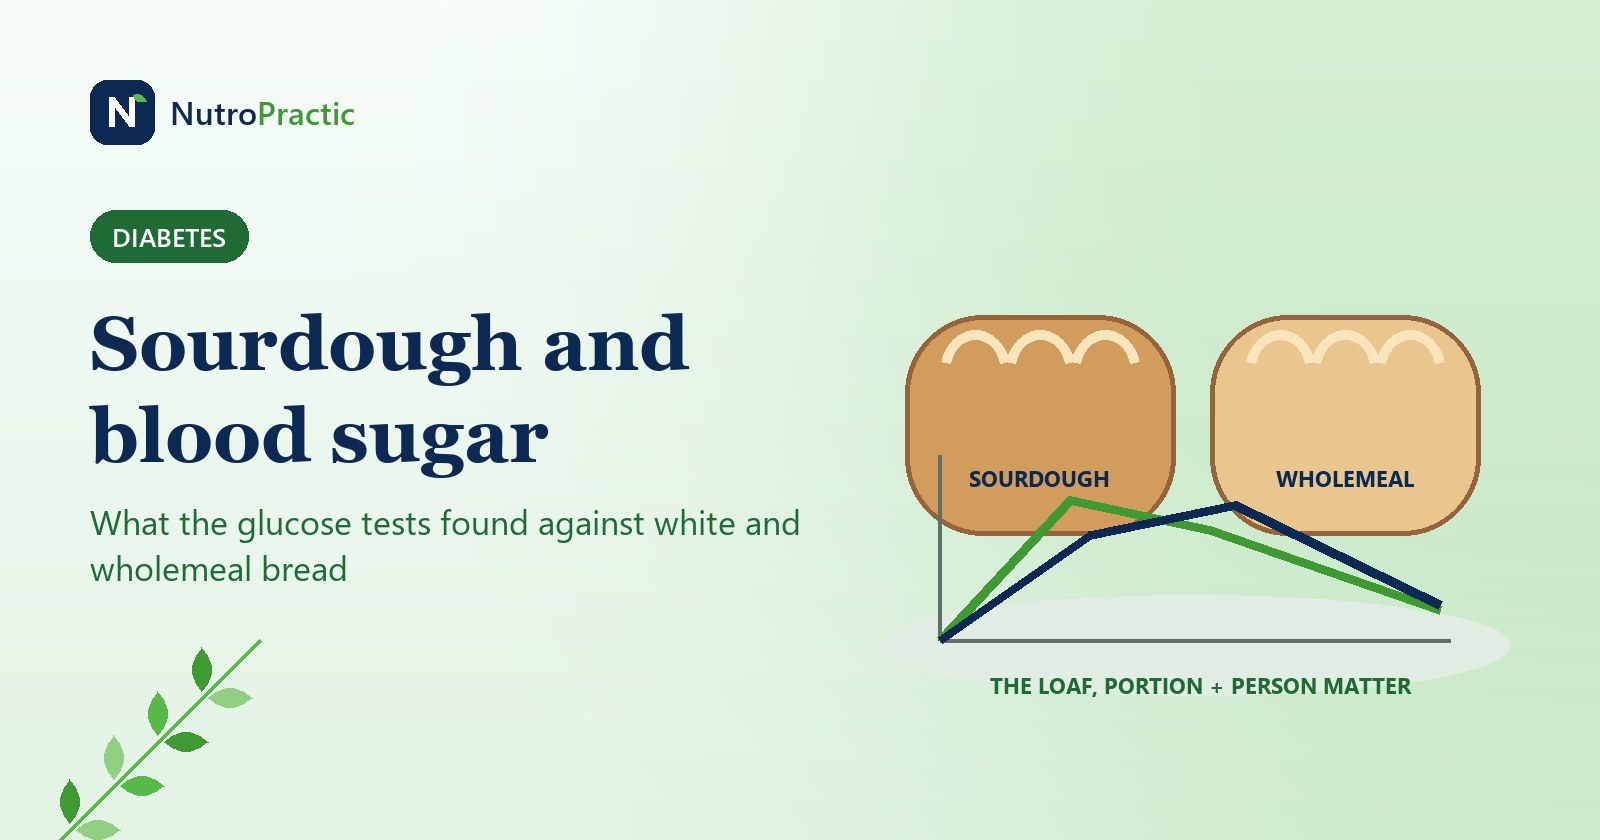
Sourdough and blood sugar: what the glucose tests found against white and wholemeal bread
Sourdough did not beat white bread on average in a 20-person crossover trial, and half responded better to white. A trial-by-trial look at fermentation, flour, portions, GI and how to test your own loaf fairly.
6 Nov 2026
Newsfeed for your website
Want this feed on your website?
Add it to any site with one copy-and-paste snippet. No sign-up, and it updates itself every hour.
Start with a virtual consultation
Tell Dr. Triveni what you want to change. You will leave with a clear next step, whether you are in Toronto, London, New York or Chennai.