Drinking water · October 12, 2026
People in Britain's hard-water areas had slightly smaller brains on MRI. The researchers expected the opposite, and the link weakened when they allowed for where people lived
A study of 34,183 brain scans from the UK Biobank set out to show that the calcium and magnesium in hard tap water protect the brain. It found a small link the other way. Before you buy a water softener, look at which homes ended up in the hardest-water group, and at the one adjustment the authors chose to leave out.
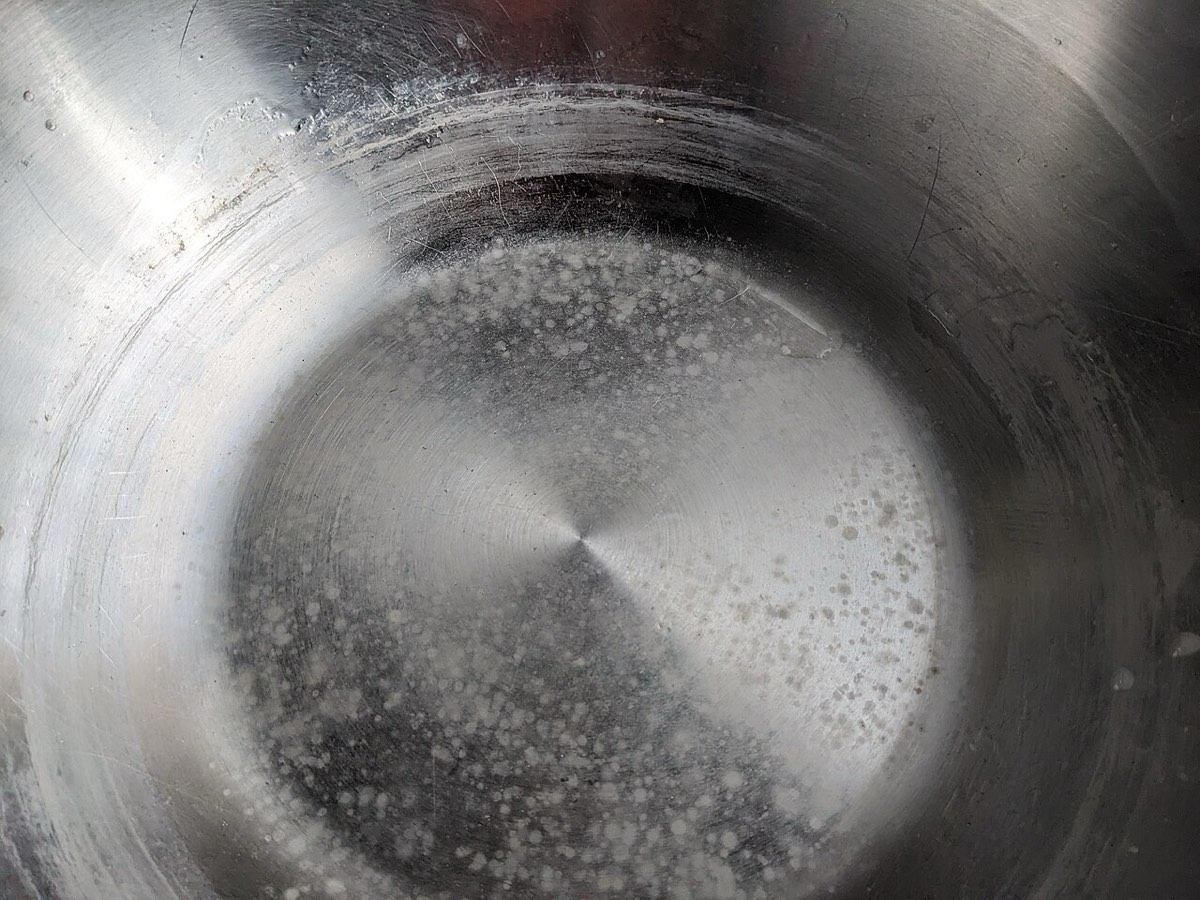
Hard water is water carrying a lot of dissolved calcium and magnesium, picked up from chalk and limestone on its way to the tap. It is what leaves the white crust in kettles and on shower heads. For decades it has had a reasonably good name in health research: studies of whole populations have tended to find slightly less heart disease and high blood pressure where the water is hard. So when a radiology group in Beijing went looking at hard water and the brain, they expected good news. Their stated hypothesis was that harder water would go with larger, better-preserved brains.
They used the UK Biobank, which recruited half a million middle-aged Britons between 2006 and 2010 and later scanned the brains of tens of thousands of them. Each person's water hardness was taken from the 2005 figures for the water supply zone of their home postcode, as reported by the water companies. The brain measure was volume on a single MRI scan: whole brain, white matter, grey matter and 122 smaller regions, each scaled for head size. After people with missing data or a neurological diagnosis such as stroke, dementia or multiple sclerosis were left out, 34,183 remained. The paper was published in Health Data Science on 6 October 2026.
The result went the other way. Compared with people on soft water (up to 60 mg of calcium carbonate per litre), people on the hardest water (over 180 mg/l) had slightly lower total brain volume, white matter and grey matter. Calcium on its own showed the same pattern. Magnesium did not: more of it went with a little more grey matter, up to about 4.5 mg/l, after which the curve turned down again. The links were stronger in people over 60.
How big is 'slightly'? The difference in total brain volume for the hardest-water group was 0.06 of a standard deviation. The authors translate that as roughly 0.6% of brain volume and compare it to one to two years of normal brain ageing. That comparison is theirs, and it is a fair way to make a small number feel real, but it is still a small number, measured once, in a population where brain size varies a great deal from person to person.
The pattern across the four hardness groups is also less tidy than the headline suggests. The moderately hard group (60 to 120 mg/l) had slightly smaller brains than the soft-water group. The hard group (120 to 180 mg/l) had slightly larger ones, though that difference could be chance. Then the very hard group was smaller again. If calcium in water were steadily shrinking brains, you would expect each step up to look worse than the last.
The bigger issue is geography. Water hardness in Britain is set by the rocks under each region, so it maps closely onto where people live, and where people live comes with its own air, jobs, incomes, accents, hospitals and scanners. The table of participants shows it: the hardest-water group had more people in the lowest deprivation band (27% against 18%), more people with high incomes (12% against 7%) and more than twice the share of non-White participants (5.7% against 2.0%) compared with the soft-water group. The study adjusted for income, deprivation, education, ethnicity, smoking, drinking, exercise, weight, diet and more. But the authors also report that when they adjusted for which UK Biobank assessment centre each person attended, a rough stand-in for region, the associations weakened. They chose to leave that adjustment out, arguing it overcorrects because hardness and location are so tightly linked, and they accept that 'residual spatial confounding cannot be ruled out'.
That choice is defensible, but it cuts both ways. If an adjustment for region shrinks the link, the study cannot easily tell apart 'hard water does something to the brain' and 'people in hard-water regions differ in ways the other adjustments did not capture'. The paper also had no data on other things in the water, such as fluoride, sulphate or industrial contaminants, nor on whether people drank tap water, filtered it or used a softener at home. The water figure is for one year, 2005, applied to a scan taken about a decade later.
Our reading: this is a large, carefully described data analysis that turned up an unexpected and small association, and the authors are right to call for it to be repeated. It does not show that hard water harms the brain, and the authors' own suggestion that drinking-water minerals could be adjusted 'for neuroprotection' runs well ahead of what one observational study can carry. If you live in a hard-water area, nothing here is a reason to switch to bottled water or install a softener for your health. Calcium and magnesium from water are a small part of what most people get from food, and the earlier heart research, also observational, pointed in the opposite direction.
Domestic water hardness and brain volume on MRI: UK Biobank, 34,183 adults, water hardness by home postcode (2005), single brain scan from 2014 onwards
β −0.06
Total brain volume in the hardest-water group (over 180 mg/l calcium carbonate) against soft water (0 to 60 mg/l), in standard deviations. 95% confidence interval −0.09 to −0.04. The authors put it at about 0.6% of brain volume
β +0.03
Total brain volume in the 120 to 180 mg/l group against soft water. 95% confidence interval −0.02 to 0.07, so it could be chance, but it points the other way from the groups either side
β −0.12
Total brain volume in the hardest-water group among people over 60, the strongest subgroup result. 95% confidence interval −0.16 to −0.08
~4.5 mg/l
Magnesium level in tap water at which grey matter volume peaked. More magnesium went with slightly more grey matter up to that point, then the curve turned down
34,183
People analysed, out of 502,412 recruited. Most were left out because they had no brain scan or no water hardness figure
27% vs 18%
Share of people in the lowest deprivation band in the hardest-water group against the soft-water group: one sign that the groups lived in different kinds of places
Figures are from the full open-access paper (Health Data Science, volume 6, article 0469, CC BY 4.0), read on PubMed Central. It was received on 16 June 2025, accepted on 15 April 2026 and published on 6 October 2026. β is the difference in brain volume in standard deviations, after adjustment for age, sex, ethnicity, deprivation, education, employment, income, smoking, alcohol, physical activity, BMI, cardiovascular disease, diabetes and a healthy-diet score; brain volumes were scaled for head size. Numbers in each hardness group: 15,677 (0 to 60 mg/l), 7,992 (60 to 120), 1,504 (120 to 180) and 9,010 (over 180). The 60 to 120 mg/l group: total brain volume β −0.04 (−0.06 to −0.02), white matter −0.04, grey matter −0.03. Hardest-water group: white matter −0.07 (−0.09 to −0.04), grey matter −0.04 (−0.06 to −0.02). Per standard deviation of calcium in the water: total brain volume −0.05, white matter −0.07, grey matter −0.03. Per standard deviation of magnesium: grey matter +0.02, no clear link with total brain volume or white matter. The paper reports that adjusting for assessment centre attenuated the associations but does not give those figures in the main text. Sensitivity analyses (hardness as a continuous measure, the WHO cut-off of 200 mg/l, time between the water data and the scan, and people who had not moved house) are reported as consistent; their tables are in a supplement we did not read. The comparison with one to two years of brain ageing is the authors', based on an assumed loss of 0.2% to 0.5% a year. Brain volume was measured on one scan, so the study shows differences between people, not shrinkage over time; the paper describes its design as prospective. Included participants were younger, wealthier and healthier than those left out. The authors report funding from the National Natural Science Foundation of China and two Chinese research programmes, and no competing interests. The geography of hard water in Britain is general knowledge, not a finding of the paper.
- The authors started out expecting hard water to protect the brain, because calcium and magnesium have been linked with lower blood pressure. They say so in the paper and describe the result as 'an intriguing divergence' from their hypothesis.
- Water hardness is usually given as milligrams of calcium carbonate per litre. The study used the US Geological Survey bands: soft up to 60, moderately hard up to 120, hard up to 180 and very hard above that. The World Health Organization's figure of 200 mg/l is about when scale build-up becomes a nuisance, not a health limit.
- A UK postcode covers about 15 households on average, according to the paper, so everyone on the same postcode was given the same water hardness figure.
- In Britain the hardest water generally comes from chalk and limestone areas in the south and east of England, and the softest from the granite and other hard rock of Scotland, Wales and the north-west.
- The paper includes a declaration that its authors used ChatGPT to polish the language and grammar, and that they reviewed the text and take responsibility for it.
- Association Between Domestic Water Hardness and MRI-Based Measures of Brain Volume: Evidence from the UK BiobankHealth Data Science, 6 October 2026 · The study
- Full text on PubMed Central (PMC13639142)US National Library of Medicine · Read in full: main text and tables; supplementary tables not read
- PubMed record (PMID 42840360)US National Library of Medicine · Abstract and dates
- Limescale deposit in a cooking potWikimedia Commons · Image, CC0
General information, not medical advice. This study found an association, not a cause. Tap water that meets your national standards is safe to drink whether it is hard or soft. If you have concerns about memory, thinking or brain health, talk to your doctor rather than changing your water supply. People with kidney disease or on a low-sodium diet should ask before using softened water for drinking, because some softeners add sodium.
Analysis by NutroPractic from the sources listed. Written for general readers; it does not replace advice from your own doctor.
From our articles
Read, then eat a little better
Plain-language guides on nutrition and wellness, backed by research.
Global data
Diabetes, obesity, child malnutrition and hunger, 1980 to 2050: what the numbers show
How diabetes, obesity, child malnutrition and hunger have changed since 1980, with sourced figures and a basic projection to 2050. Click a condition to explore the chart and its facts.
5 Oct 2026
Indian kitchen
Rice, roti and blood sugar: building a balanced Indian plate with the ICMR-NIN 2024 guidelines
About one in nine Indian adults has diabetes and many more have prediabetes. You don't have to give up rice or roti. How the ICMR-NIN Dietary Guidelines for Indians (2024) suggest building a plate, plus simple habits that help keep blood sugar steady.
3 Oct 2026
Micronutrients
Vitamin D and B12: two common gaps, from northern winters to vegetarian kitchens
Vitamin D runs low in Canadian and European winters, and surprisingly often in sunny India too. Vitamin B12 is a risk for vegetarians, people over 50 and people on certain medicines. Who is at risk, what the official advice is in North America, Europe and India, and where to get both.
3 Oct 2026
Newsfeed for your website
Want this feed on your website?
Add it to any site with one copy-and-paste snippet. No sign-up, and it updates itself every hour.
Start with a virtual consultation
Tell Dr. Triveni what you want to change. You will leave with a clear next step, whether you are in Toronto, London, New York or Chennai.