Food preferences · October 13, 2026
Researchers sorted people by the foods they said they liked, not the foods they ate. The sweet-tooth group went on to have 79% more dementia
A UK Biobank analysis grouped adults into three taste profiles from a questionnaire about food likes and dislikes. People whose answers leaned towards sweet foods and sweet drinks had a higher rate of dementia later, and their blood tests made them look slightly older than their years. Yet that faster ageing explained less than a twentieth of the link, so most of the story is still missing.
Most diet research asks what you ate. It is a hard question to answer honestly. People forget, round down the biscuits and round up the vegetables, and a week of food diaries may not look much like the other fifty-one. A paper published on 7 October 2026 in the journal GeroScience tries a different question, one that is easier to answer and harder to fudge: what do you like?
The data come from UK Biobank, the long-running British study that has followed hundreds of thousands of volunteers through their health records. Part of that group filled in a food preferences questionnaire, rating how much they liked a long list of foods and drinks. The researchers, based in Hong Kong, Beijing, Weifang, Nanjing and Notre Dame in the United States, ran those answers through a statistical method called latent profile analysis. It looks for clusters of people who answer in similar ways, without being told in advance what the clusters should be.
Three profiles came out. The authors call them health-aligned, broad-preference and sweet-tooth. The names describe a pattern of liking, and nobody in the study was labelled by how much sugar they actually ate. An earlier analysis of the same questionnaire by a team at the University of Surrey, published in 2024, found three very similar groups among more than 180,000 volunteers: one that liked fruit and vegetables and was cool on sweet and animal-based foods, one that liked nearly everything, and one with a strong liking for sweet foods and sweetened drinks.
The new paper then followed people forward through their medical records. Compared with the health-aligned group, the sweet-tooth group had a 79% higher risk of dementia from any cause, a 62% higher risk of Alzheimer's disease and a 202% higher risk of vascular dementia, which works out at roughly three times the rate. Vascular dementia is the kind caused by damage to the blood supply of the brain, so it is the type you would expect to track most closely with diet, blood sugar and blood pressure. That the largest figure lands there fits the rest of what is known, although it does not prove anything on its own.
The researchers also looked at three measures of biological ageing. Two are scores built from routine blood tests and body measurements that estimate whether a body looks older or younger than its birth certificate. The third is the length of telomeres, the protective caps on the ends of chromosomes, measured in white blood cells. On all three the sweet-tooth group came out worse: older on both scores and with shorter telomeres.
The obvious next step is to ask whether faster ageing is the route from a sweet tooth to dementia. The answer in this study is: barely. The ageing markers statistically accounted for between 2.28% and 4.82% of the association. More than 95% of the link runs through something these markers do not capture. That could be blood sugar, weight, blood vessels or sleep, or it could be something that has nothing to do with food.
Genes mattered too. People with a high inherited risk of dementia who also had a sweet-tooth profile did worse than you would predict by adding the two risks together. The authors read this as a reason to aim dietary advice at people with a family or genetic risk.
Now the cautions, and there are several. This is an observational study. People with a sweet-tooth profile may differ from the others in income, education, smoking, exercise, weight and mood, and no statistical adjustment removes all of that. The earlier Surrey analysis found that the sweet-tooth group also had more depression, diabetes and stroke, each of which is linked with dementia in its own right. There is also a question of which came first. Changes in taste and a growing preference for sweet food are recognised in some forms of dementia, sometimes years before a diagnosis, so some of the liking could be an early sign of the illness and not a cause of it.
A note on what we could check. The full paper sits behind the journal's paywall, and the published abstract gives the percentages above but not the number of participants, the number of dementia cases, the length of follow-up or the confidence intervals. We have left those out instead of guessing. A relative figure such as 79% also says nothing about how common dementia was in either group; in studies of middle-aged and older volunteers the absolute numbers are usually small.
So what can a reader take from this? A liking for sweet things is not a diagnosis, and nobody chooses their palate. Still, what you like is a fair guide to what you will eat over forty years, and this study adds dementia to a list that already includes diabetes and stroke. Tastes do shift with habit. People who cut back on sugar in tea or coffee often find, a few weeks later, that the old amount tastes too sweet. If dementia runs in your family, that small retraining may be worth the effort.
Prospective cohort study (UK Biobank): three food preference profiles from a questionnaire about food likes, followed for later dementia and compared on three measures of biological ageing
3
Food preference profiles found by latent profile analysis: health-aligned, broad-preference and sweet-tooth
+79%
Higher risk of dementia from any cause in the sweet-tooth group, compared with the health-aligned group
+62%
Higher risk of Alzheimer's disease in the sweet-tooth group, compared with the health-aligned group
+202%
Higher risk of vascular dementia in the sweet-tooth group, compared with the health-aligned group. That is about three times the rate
3 of 3
Ageing measures on which the sweet-tooth group looked older: two blood-test ageing scores (KDM biological age and PhenoAge) and shorter telomeres in white blood cells
2.28% to 4.82%
Share of the sweet-tooth and dementia link that the ageing markers statistically accounted for. The rest is unexplained by them
Figures are from the published abstract of the paper (doi 10.1007/s11357-026-02567-3, GeroScience, published online 7 October 2026) and its PubMed record. The full text is behind a paywall and we could not read it, so the number of participants, the number of dementia cases, the years of follow-up, the confidence intervals and the list of factors adjusted for are not given here. Risks come from Cox regression models and are relative: they compare the sweet-tooth group with the health-aligned group and do not show anyone's absolute risk. The abstract reports a significant additive interaction between the sweet-tooth profile and high genetic risk, without figures. The authors describe the mediation analysis as exploratory. Profiles are based on what people said they liked, not on measured intake. The 180,000 figure and the description of the three groups in the story come from a separate, open access 2024 paper that analysed the same UK Biobank questionnaire; the new paper's own sample size may differ. The authors declare no competing interests.
- The 2024 University of Surrey analysis of the same UK Biobank questionnaire found that the sweet-tooth group had a 27% higher risk of depression, 15% higher risk of diabetes and 22% higher risk of stroke than the other two groups put together.
- Telomeres are stretches of repeated DNA at the tips of chromosomes. They get a little shorter each time a cell divides, which is why researchers use their length as one rough clock of ageing.
- The World Health Organization advises keeping free sugars below 10% of daily energy, and suggests that going below 5% brings extra benefit. Free sugars include those added to food and drinks and the sugars in honey, syrups and fruit juice.
- Vascular dementia is generally counted as the second most common type of dementia after Alzheimer's disease, and the two often occur together in the same person.
- Asking people what they like has one practical advantage over asking what they eat: it takes a few minutes, and the answers do not depend on remembering last Tuesday's lunch.
- Dietary preference, biological aging, and incident dementia: a prospective cohort studyGeroScience, published online 7 October 2026 (subscription; abstract free to read) · The new paper: the three profiles, dementia risks, ageing measures, genetic interaction and mediation figures, from the abstract
- PubMed record 42842075US National Library of Medicine · Abstract, author affiliations and the statement that the data are from UK Biobank
- Artificial intelligence driven definition of food preference endotypes in UK Biobank volunteers is associated with distinctive health outcomes and blood based metabolomic and proteomic profilesJournal of Translational Medicine, 22, 881, 1 October 2024 (open access) · Earlier analysis of the same questionnaire in more than 180,000 volunteers: the three groups and the depression, diabetes and stroke figures
- Guideline: sugars intake for adults and childrenWorld Health Organization, 2015 · The 10% and 5% recommendations on free sugars
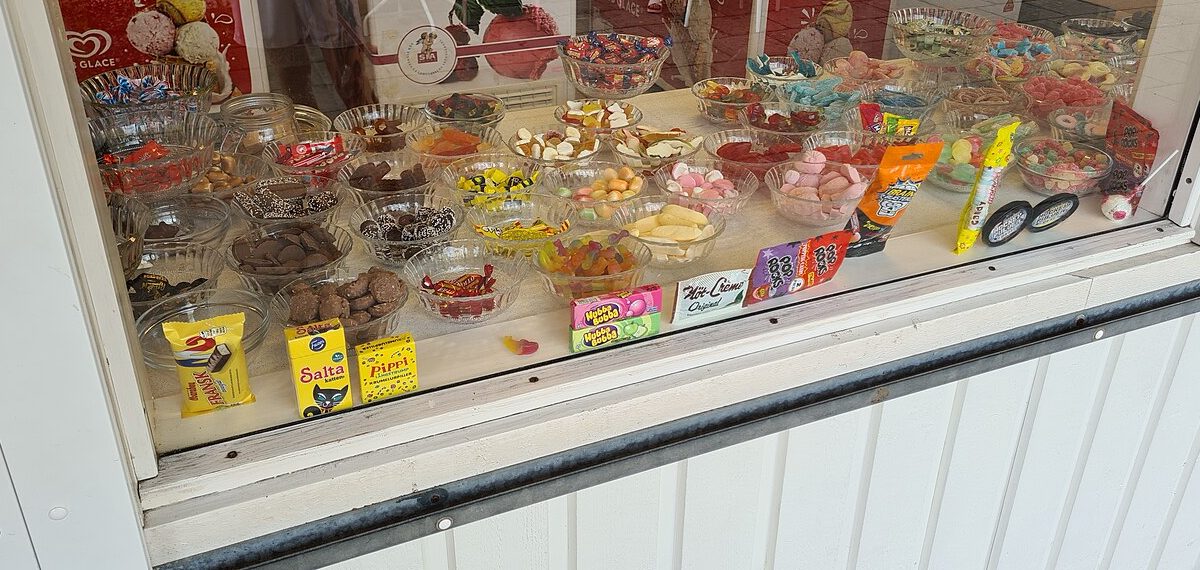
- Pekgodis.jpgWikimedia Commons · Image, CC0, by Christoffre
General information, not medical advice. This was an observational study of food preferences; it cannot show that liking or eating sweet foods causes dementia, and we could read only its abstract. If you are worried about your memory, your diet or your family history of dementia, talk to your doctor or a registered dietitian.
Analysis by NutroPractic from the sources listed. Written for general readers; it does not replace advice from your own doctor.
From our articles
Read, then eat a little better
Plain-language guides on nutrition and wellness, backed by research.
Global data
Diabetes, obesity, child malnutrition and hunger, 1980 to 2050: what the numbers show
How diabetes, obesity, child malnutrition and hunger have changed since 1980, with sourced figures and a basic projection to 2050. Click a condition to explore the chart and its facts.
5 Oct 2026
Indian kitchen
Rice, roti and blood sugar: building a balanced Indian plate with the ICMR-NIN 2024 guidelines
About one in nine Indian adults has diabetes and many more have prediabetes. You don't have to give up rice or roti. How the ICMR-NIN Dietary Guidelines for Indians (2024) suggest building a plate, plus simple habits that help keep blood sugar steady.
3 Oct 2026
Micronutrients
Vitamin D and B12: two common gaps, from northern winters to vegetarian kitchens
Vitamin D runs low in Canadian and European winters, and surprisingly often in sunny India too. Vitamin B12 is a risk for vegetarians, people over 50 and people on certain medicines. Who is at risk, what the official advice is in North America, Europe and India, and where to get both.
3 Oct 2026
Newsfeed for your website
Want this feed on your website?
Add it to any site with one copy-and-paste snippet. No sign-up, and it updates itself every hour.
Start with a virtual consultation
Tell Dr. Triveni what you want to change. You will leave with a clear next step, whether you are in Toronto, London, New York or Chennai.