Food insecurity · October 12, 2026
Poor, over 65 and rarely able to leave the house: more than four in ten Americans in that position got neither food stamps nor Meals on Wheels. Of those who did get help, more than a third still went without
A national survey found about 3.9 million older Americans who are both homebound and poor enough for food stamps. Just over half got food stamps, delivered meals or both. Oddly, the people getting help were more often short of food than the people getting none. The way the study counts 'short of food' explains a good part of that, and it changes what the number means.
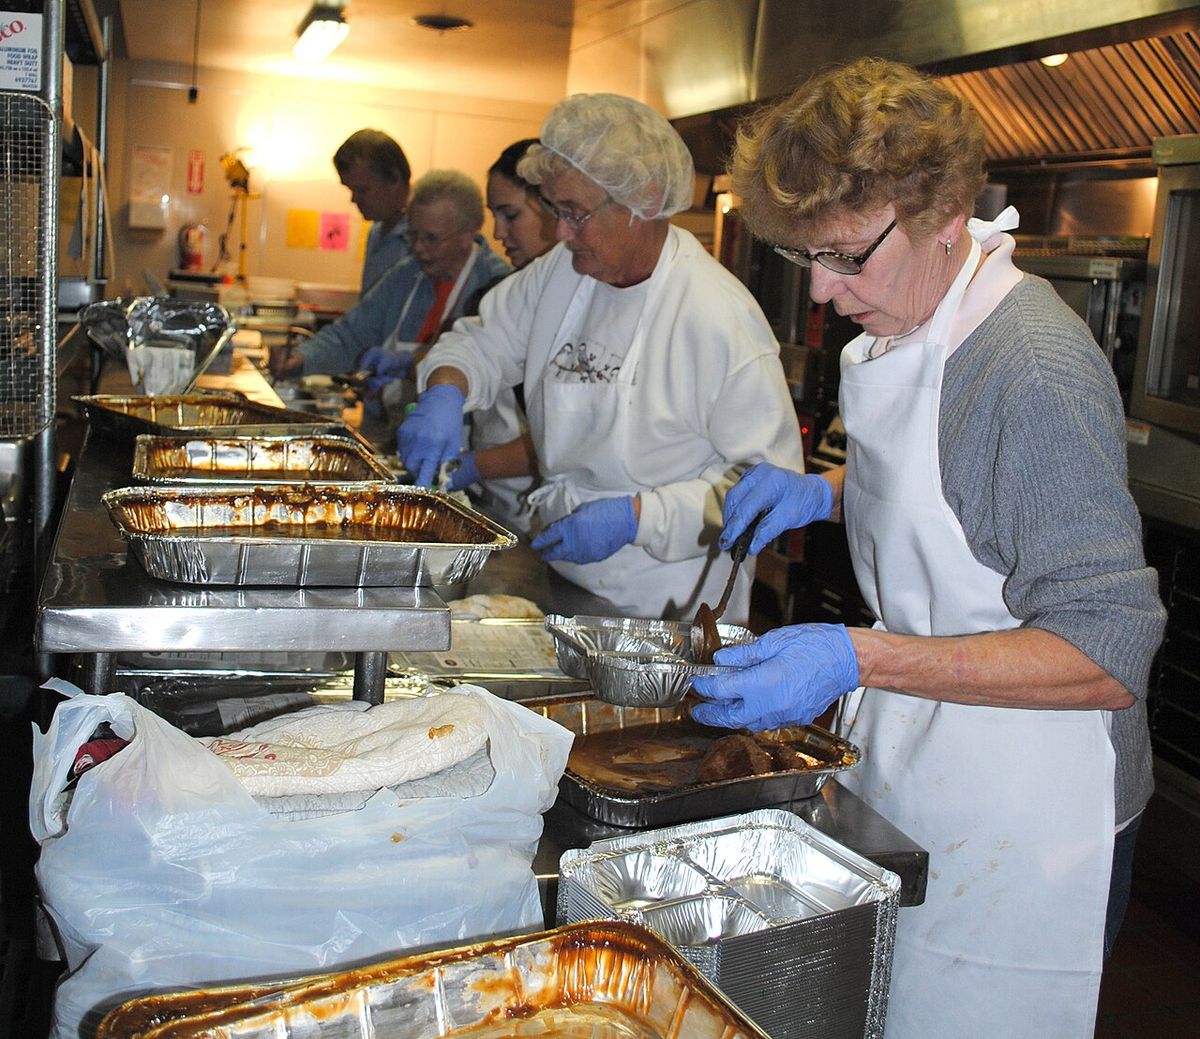
Some older people hardly ever leave the house. They can't manage the steps, or the walk, or they need someone with them to do it. In the United States there are millions of them still living at home, and they are poorer, sicker and more often alone than other people their age. Getting food in is a daily problem that money only partly solves. A team at Johns Hopkins University School of Nursing, with a colleague in Arizona, asked how many of them are reached by the two best-known kinds of help: food stamps (SNAP, the Supplemental Nutrition Assistance Program) and delivered meals such as Meals on Wheels. Their paper came out in Health Affairs Scholar on 1 October 2026.
They used the National Health and Aging Trends Study, which interviews a national sample of people aged 65 and over on Medicare every year. From the round run between May 2023 and April 2024 they took everyone who lived in the community, was homebound (never or rarely went out, found it hard, or needed help to do it) and had a household income at or below 130% of the federal poverty line, the usual income limit for SNAP. That gave 1,091 people. With the survey's weights they stand for about 3.9 million Americans. Their average age was 78, seven in ten were women, a third lived alone and a quarter probably had dementia.
Just over half, 55.5%, had some food assistance: 35.1% had SNAP only, 10.9% had delivered meals only and 9.4% had both. The remaining 44.5%, about 1.75 million people, had neither. The paper's title puts this as the programmes serving 'the majority'. Seen from the other side, more than four in ten people who are poor enough to qualify and can barely get to a shop were getting nothing from either. And adding the two meal figures together, only about one in five had any delivered meals at all, the one service built for people who can't go out.
Then the result that looks backwards. Among people with no assistance, 24.0% were food insecure. Among people with assistance it was 36.4%. By programme it climbed in steps: 33.6% with SNAP only, 39.4% with delivered meals only and 44.1% with both. Nobody should read that as the programmes making people go hungry. The people on them were worse off to begin with: they needed help with more everyday tasks (4.3 basic activities such as bathing and dressing, against 3.7), and 41.8% lived alone against 21.8%. People in the most trouble are the ones who apply, or get signed up by a relative or a nurse.
The yardstick matters as much. This is not the US government's food security questionnaire, which is about money. The survey uses five questions, and a yes to any one counts: skipping meals because there wasn't enough money, doing so for more than a few days, and three about going without groceries, hot meals or eating because you couldn't manage it yourself and nobody was there to help. So a person can count as food insecure with enough money in the bank, because they can't stand at a stove. The authors say this is deliberate, and for this group it is the right thing to measure. It also means the measure and the delivered-meals question overlap. People were asked how often their hot meals came from Meals on Wheels or a similar programme, and people who can't cook are the ones who end up on it.
What the higher figure does show is that being enrolled is not the same as having enough. A food stamp card is no use to someone who can't get to the shop or cook what they buy. A delivered meal is one meal, and the rest of the day still has to be managed. The authors' argument is for more capacity and easier sign-up: SNAP paperwork and renewals are hard for someone with disabilities, and they cite a 2026 figure that one in three Meals on Wheels providers has a waiting list.
Among the 465 people with no help, 97 were food insecure. They needed help with more daily tasks than the rest (5.0 against 3.2) and were about twice as likely to live alone (35.0% against 17.8%). That second comparison only just passes the usual test for chance (p = 0.049), on 97 people. By our own arithmetic from the paper's weighted figures, that group stands for roughly 420,000 people nationally who are poor, homebound, short of food and on neither programme, and about 790,000 more are short of food while on one. The paper does not give those two totals.
The limits are mostly the authors' own. Everything is from interviews, some answered by a relative on the person's behalf. The delivered-meals questions lump Meals on Wheels with 'other food assistance' and count anyone who 'rarely' had such a meal, so that group is wider than the name suggests. Food stamp use is usually under-reported in surveys. It is one snapshot, so it can't show whether help reduced anyone's hunger; earlier studies the paper cites suggest it does. Other routes, such as Medicare Advantage food benefits or Medicaid programmes, were not counted. Two things we'd add: about six in ten of the people invited took part in that survey round, and the paper has no direct look at what anyone actually ate.
Our reading: the headline could have been written either way, and the gap is the more useful half. Roughly one in four of the homebound poor with no help said they were going without, and those people were frailer and more alone than their neighbours. If you have an older relative or neighbour who doesn't get out, the questions worth asking are plain ones: who does the shopping, who cooks, and what happens on the days nobody comes. In the US, the local Area Agency on Aging is a usual first call for delivered meals, and many can help with a SNAP application.
Cross-sectional analysis of 1,091 homebound, low-income (at or below 130% of the federal poverty line) community-dwelling Medicare beneficiaries aged 65 and over, National Health and Aging Trends Study Round 13, United States, May 2023 to April 2024; weighted to about 3.9 million people
44.5%
Received neither SNAP nor Meals on Wheels-type meals (465 of 1,091 people in the sample; about 1.75 million nationally)
55.5%
Received at least one: SNAP only 35.1%, delivered meals only 10.9%, both 9.4% (about 2.18 million nationally)
36.4% vs 24.0%
Food insecure among people with food assistance, against people with none (p = 0.009). Overall 31.0%
44.1%
Food insecure among people receiving both programmes; 39.4% with delivered meals only, 33.6% with SNAP only
41.8% vs 21.8%
Living alone, people with food assistance against people with none (p < 0.001)
35.0% vs 17.8%
Living alone among people with no assistance: the food insecure (97 people) against the food secure (368 people), p = 0.049
Figures are from the open-access paper in Health Affairs Scholar (doi 10.1093/haschl/qxag260, volume 4, issue 10, qxag260, published online 1 October 2026, CC BY 4.0), read in full on PubMed Central: introduction, methods, limitations, results, Tables 1 and 2, the captions and text descriptions of Figures 1 and 2, discussion, conclusions and funding. The supplementary tables (measure definitions, sample derivation, sensitivity analyses, the four-group comparison and the multivariable model) were not read; where we quote them it is from the main text. All percentages are survey-weighted; the counts of people (1,091; 465; 626; 397 SNAP only; 121 delivered meals only; 108 both; 368; 97) are unweighted. Weighted national numbers from Figure 1: SNAP only 1,381,252; delivered meals only 428,386; both 369,542; neither 1,750,718. Survey response rate for the round: 60.6% unweighted, 67.2% weighted. SNAP receipt: help from SNAP in the past year, or paying for groceries with food stamps in the past month. Meals on Wheels receipt: help in the past year from 'other food assistance such as Meals-on-Wheels', or any hot meals in the past month from 'Meals on Wheels or other food assistance programs' (every time, most times, sometimes or rarely). Food insecurity: five items (skipped meals for lack of money in the last month; did so for more than a few days; went without groceries, without hot meals, or without eating for lack of ability or help), score 0 to 5, 1 or more counted as food insecure. Whole sample: mean age 77.7, 72.0% women, 48.2% non-Hispanic White, 17.3% non-Hispanic Black, 27.5% Hispanic, 17.6% rural, 32.8% living alone, 26.4% probable dementia, 35.2% in hospital in the last year. Recipients against non-recipients: activities of daily living needing help 4.27 vs 3.66 (p = 0.005), instrumental activities 2.34 vs 1.80 (p = 0.005), high school or more 54.8% vs 62.8% (p = 0.027). Non-recipients, food insecure against food secure: activities of daily living 5.03 vs 3.23 (p < 0.001), instrumental activities 2.33 vs 1.63 (p = 0.049). Among recipients, living alone was similar in the food insecure and food secure (43.4% vs 40.8%, p = 0.649). Living alone by programme: SNAP only 45.4%, both 45.8%, delivered meals only 26.6%. Sensitivity analyses reported in the text: food insecurity among non-recipients was 23.0% with a 200% poverty-line limit and 22.8% with a 100% limit. The 'one in five with any delivered meals' (10.9% + 9.4% = 20.3%) and the national totals of about 420,000 (24.0% of 1.75 million) and about 790,000 (36.4% of 2.18 million) are our arithmetic from the paper's weighted figures, not numbers the paper reports, and they are rounded. The remarks on the overlap between the food insecurity items and the delivered-meals question are ours. Funding: US National Institute on Aging grants. Conflicts of interest: the authors declare none.
- Only about half of older Americans who qualify for SNAP are enrolled, the paper notes, citing earlier work. The reasons given are stigma, a cumbersome application and the expectation that the benefit will be small.
- Meals on Wheels is not one organisation. The paper describes it as a national network of more than 5,000 independent community programmes, funded in large part through the nutrition programme of the Older Americans Act, which dates from 1972. There is no income test to receive meals.
- Extra pandemic-era SNAP payments ended in February 2023, a few months before this survey round began. The authors say enrolment in 2023 may still have been higher than in a normal year.
- Some US states use simplified routes that have raised enrolment among older people, the paper says: one lets people already on Supplemental Security Income join SNAP with a combined application, another shortens the form and the renewal for households of older adults.
- The authors point out that being homebound is often not permanent. Someone just home from hospital may be housebound for weeks, and they single out delivered meals in that period as a way to keep people at home and out of trouble.
- Food assistance programs serve the majority of low-income, homebound older adults, yet food insecurity remainsHealth Affairs Scholar, 1 October 2026 · The study. Open access, read in full; supplementary tables not read
- Full text on PubMed Central (PMC13648203)US National Library of Medicine · Version read for this item
- PubMed record (PMID 42852050)US National Library of Medicine · Abstract and authors
- Meals on Wheels food prepWikimedia Commons · Image, public domain, U.S. Air Force photo by Airman 1st Class Katrina Heikkinen
General information, not medical or benefits advice. Programme rules differ by country and by US state. If you or an older person you care for is often missing meals or losing weight without trying, tell a doctor or nurse, and ask the local agency for older people's services about delivered meals and help with applications.
Analysis by NutroPractic from the sources listed. Written for general readers; it does not replace advice from your own doctor.
From our articles
Read, then eat a little better
Plain-language guides on nutrition and wellness, backed by research.
Global data
Diabetes, obesity, child malnutrition and hunger, 1980 to 2050: what the numbers show
How diabetes, obesity, child malnutrition and hunger have changed since 1980, with sourced figures and a basic projection to 2050. Click a condition to explore the chart and its facts.
5 Oct 2026
Indian kitchen
Rice, roti and blood sugar: building a balanced Indian plate with the ICMR-NIN 2024 guidelines
About one in nine Indian adults has diabetes and many more have prediabetes. You don't have to give up rice or roti. How the ICMR-NIN Dietary Guidelines for Indians (2024) suggest building a plate, plus simple habits that help keep blood sugar steady.
3 Oct 2026
Micronutrients
Vitamin D and B12: two common gaps, from northern winters to vegetarian kitchens
Vitamin D runs low in Canadian and European winters, and surprisingly often in sunny India too. Vitamin B12 is a risk for vegetarians, people over 50 and people on certain medicines. Who is at risk, what the official advice is in North America, Europe and India, and where to get both.
3 Oct 2026
Newsfeed for your website
Want this feed on your website?
Add it to any site with one copy-and-paste snippet. No sign-up, and it updates itself every hour.
Start with a virtual consultation
Tell Dr. Triveni what you want to change. You will leave with a clear next step, whether you are in Toronto, London, New York or Chennai.