Sustainable diets · October 12, 2026
Finns who ate closer to the 'planetary health diet' had slightly smaller waists, and a blood test offers a reason why. The average score was under 4 out of 13, and over seven years the diet did not predict who gained weight
Researchers in Helsinki scored the diets of 9,225 adults against the diet designed to feed the world without wrecking it, then measured 158 substances in their blood. The fats in the blood seemed to explain up to half of the link with waist size. Look closer and the blood test is partly measuring the diet score a second time, and the second group of 10,242 Finns confirmed much less of it.
The planetary health diet was drawn up in 2019 by a commission of scientists asking what ten billion people could eat without exhausting the land and water that feed them. Their answer was a plate heavy on whole grains, vegetables, fruit, beans and nuts, with small amounts of meat and dairy. Since then a second question has followed it around: is the diet that is kind to the planet also kind to the waistline? Several studies say people who eat closer to it weigh less. A paper from the Finnish Institute for Health and Welfare, published in the European Journal of Nutrition on 7 October 2026, tries to say why.
The team took two national health surveys, FinHealth 2017 and a 2007 study called DILGOM, and pooled 9,225 adults with an average age of 54. Each had filled in a questionnaire on what they ate over the past year, been weighed and measured, and given blood. The diet was scored out of 13: one point each for enough whole grains, vegetables, fruit and berries, legumes, and nuts and seeds; one each for keeping potatoes, dairy, red and processed meat, poultry, eggs, fish and sugar under a limit; and one for a high ratio of unsaturated to saturated fat. The blood went through a machine that reads 158 substances at once, mostly fats and the particles that carry them, plus some amino acids.
First, the diet and the tape measure. Each extra point on the score went with a waist about 0.4 cm smaller in men and 0.5 cm smaller in women, after allowing for age, exercise, smoking and cholesterol medicines. For scale, the average waist in the study was 98 cm for men and 88 cm for women. Women with higher scores also weighed a little less; in men the link with weight and BMI did not hold up.
Then the blood. Of the 158 substances, seven tracked the diet score in both sexes: acetate, which gut bacteria make when they ferment fibre, and six measures of the kind of fat in the blood, such as the share that is polyunsaturated or saturated. When the researchers put these into the sums one at a time, the link between diet and waist shrank. The share of polyunsaturated fat appeared to account for 36% of it in men and 47% in women, linoleic acid's share for 31% and 50%. Acetate accounted for much less, 8% and 4%. Their conclusion is that better fat quality and more fibre may be part of how such a diet keeps waists smaller.
It is a reasonable idea, and the paper is frank that it is only suggested. We would add a few things a reader should know before repeating it. The first is how far these Finns were from the diet. The average score was 3.4 out of 13 for men and 4.1 for women. Men ate 162 g of red and processed meat a day against a limit of 28 g, 15 g of legumes against a target of 75 g, and 4 g of nuts against 25 g. So this is not a study of people on the planetary health diet. It compares people who meet three of its targets with people who meet five.
The second is the result that is easy to miss. Part of the group was measured again seven years later, and the diet score had no relationship at all with who gained or lost weight or waist in between. The estimates sit at zero. Everything the paper builds on comes from a single day: the diet, the waist and the blood were all recorded together. On one day's data nobody can tell which came first, and the authors say plainly that a larger waist can itself change what is in the blood.
The third is our own reading, not the authors'. One of the 13 points is awarded for the ratio of unsaturated to saturated fat in the diet. The blood measures that explained the most are the ratio of polyunsaturated and saturated fats in the blood. Blood fatty acids are a well-known mirror of the fats a person eats, which the paper itself notes. So when the blood measure 'explains' half the link, it may be showing the diet score a second time, more accurately than a questionnaire can, and not a new step between plate and waist. The measures also overlap heavily with each other, so the percentages cannot be added up.
The fourth is the repeat. The team ran everything again in 10,242 other Finns from two older surveys, which is good practice. There, the diet was linked to waist in women only, three substances carried the link, and each accounted for 5% to 8% of it. One of them, the omega-3 share, pointed the other way from the first group: by the paper's description it went with a larger waist. The authors put the weaker repeat down to slightly lower diet scores in those surveys. The abstract also says seven substances carried the link in both sexes, while the paper's own table shows the omega-3 share falling short of significance in men.
None of this makes whole grains, beans, nuts and vegetable oils a bad idea, and the case for them does not rest on this study. What this paper adds is modest: among adults eating a fairly ordinary Finnish diet, those a point or two closer to the planetary pattern had waists up to a centimetre smaller, and their blood showed the fats you would expect. Whether eating that way keeps weight off over time is the question the seven-year data were there to answer, and in this study they did not.
9,225 Finnish adults (4,209 men, 5,016 women, mean age 54) from FinHealth 2017 and DILGOM 2007, with a repeat in 10,242 adults from FINRISK 2012 and Health 2000
3.4 and 4.1
Average Planetary Health Diet Score out of 13 in men and women (SD 1.3 and 1.4)
-0.43 and -0.50
Difference in waist per extra score point in men and women, in cm as we read Table 3 (95% CI -0.70 to -0.17 and -0.74 to -0.25); average waist 98 cm and 88 cm
0
Links between the score and seven-year change in weight, BMI or waist that reached significance (all FDR p values 0.45 or higher)
36% and 47%
Share of the diet-waist link statistically accounted for by the polyunsaturated share of blood fatty acids, men and women (Table 4: 35.6% and 46.7%)
8% and 4%
Share accounted for by acetate, the fibre-fermentation product, men and women (Table 4: 7.6% and 3.6%)
5% to 8%
Shares accounted for in the repeat sample, where only three substances carried the link and only in women (5.1% to 8.2%)
Figures are from the open-access paper in the European Journal of Nutrition (doi 10.1007/s00394-026-04115-3, volume 65, article 269, published online 7 October 2026, CC BY 4.0), read in full on PubMed Central: methods, results, Tables 1 to 4, figure captions, discussion and limitations. The figures (plots) and the supplementary tables were not examined, so the repeat-sample results are as described in the paper's text. Design: cross-sectional analysis of pooled population health examination surveys run by the Finnish Institute for Health and Welfare, with seven-year follow-up measurements for part of one survey (DILGOM 2014: weight and BMI change in 1,582 men and 1,874 women, waist change in 538 men and 702 women; some follow-up measurements were taken by participants at home with a mailed tape). Diet came from a food frequency questionnaire of 128 to 131 items covering the past 12 months. Score cut-offs (Table 2, intakes standardised to 2,500 kcal a day): whole grains 232 g or more, vegetables 300 g or more, fruit and berries 200 g or more, legumes 75 g or more, nuts and seeds 25 g or more, potatoes 100 g or less, dairy as milk equivalents 500 g or less, red and processed meat 28 g or less, poultry 58 g or less, eggs 25 g or less, fish 100 g or less, sucrose 31 g or less, and a polyunsaturated to saturated fat ratio of 2.0 or more. Mean intakes in men and women (not energy-standardised): whole grains 75 and 68 g, vegetables 256 and 317 g, fruit and berries 193 and 251 g, legumes 15 and 15 g, nuts and seeds 4 and 5 g, red and processed meat 162 and 99 g, dairy 933 and 822 g, fat ratio 1.4 and 1.4. Blood was taken after at least four hours of fasting and 158 measures were quantified by nuclear magnetic resonance (Nightingale Health platform). Models adjusted for age, cohort, leisure-time physical activity, smoking and cholesterol-lowering medication, with false discovery rate correction. Weight and BMI were linked to the score in women only (Table 3: -0.41 kg and -0.16 kg/m2 per point; the text prints the weight estimate as -0.041). Seven-year changes, model 2: weight -0.01 and 0.01, BMI 0.01 and 0.01, waist -0.29 and -0.01 percentage points per score point in men and women, none significant. Other shares of the waist link in Table 4, men and women: linoleic acid share 31.4% and 49.9%, degree of unsaturation 26.0% and 23.1%, saturated share 12.1% and 13.0%, DHA share 5.5% and 9.6%, omega-3 share 4.0% (FDR p 0.08, not significant) and 9.8%. In women, phenylalanine 25.9%, leucine 24.1%, tyrosine 18.4% and glycine 8.8% also carried part of the link. The abstract gives 3.1% for acetate and 46.5% for the polyunsaturated share in women where Table 4 gives 3.6% and 46.7%. Each substance was tested as a mediator on its own; the shares overlap and do not sum. Repeat sample: 4,674 men and 5,568 women, mean age 52, mean score 3.3 and 3.7; waist link in women only (-0.40, FDR p 0.01); acetate, the omega-3 share and the saturated share carried it, and the text describes the omega-3 share as positively associated with waist there. The point about the fat-ratio score component and the blood fat ratios measuring the same thing is our reading. Funding: the Leg4Life project (Strategic Research Council at the Academy of Finland), Yrjo Jahnsson Foundation, Juho Vainio Foundation, Research Council of Finland, Sigrid Juselius Foundation and Novo Nordisk Foundation; the authors declare no conflicts of interest.
- The planetary health diet comes from the EAT-Lancet Commission's 2019 report and is built around a reference intake of 2,500 kcal a day.
- For the Finnish version of the score, rye, oats and barley were the foods chosen to stand for whole grains.
- Dairy was counted as 'milk equivalents': a gram of cheese counted as 5 g of milk and a gram of butter as 6.5 g, which is how the average came to more than 800 g a day.
- Acetate is a short-chain fatty acid. Besides what the body makes itself, most of it comes from gut bacteria fermenting dietary fibre.
- The paper cites a national figure that about 30% of Finnish adults were living with obesity in 2023.
- Identification of serum metabolites associated with the EAT-Lancet planetary health diet, and their mediating role in weight status and weight changes in adultsEuropean Journal of Nutrition, 7 October 2026 · The study. Open access, read in full
- Full text on PubMed Central (PMC13645858)US National Library of Medicine · Version read for this item
- PubMed record (PMID 42841987)US National Library of Medicine · Abstract and authors
- Food in the Anthropocene: the EAT-Lancet Commission on healthy diets from sustainable food systemsThe Lancet, 2019 · The report that defined the planetary health diet, cited by the paper; not read for this item
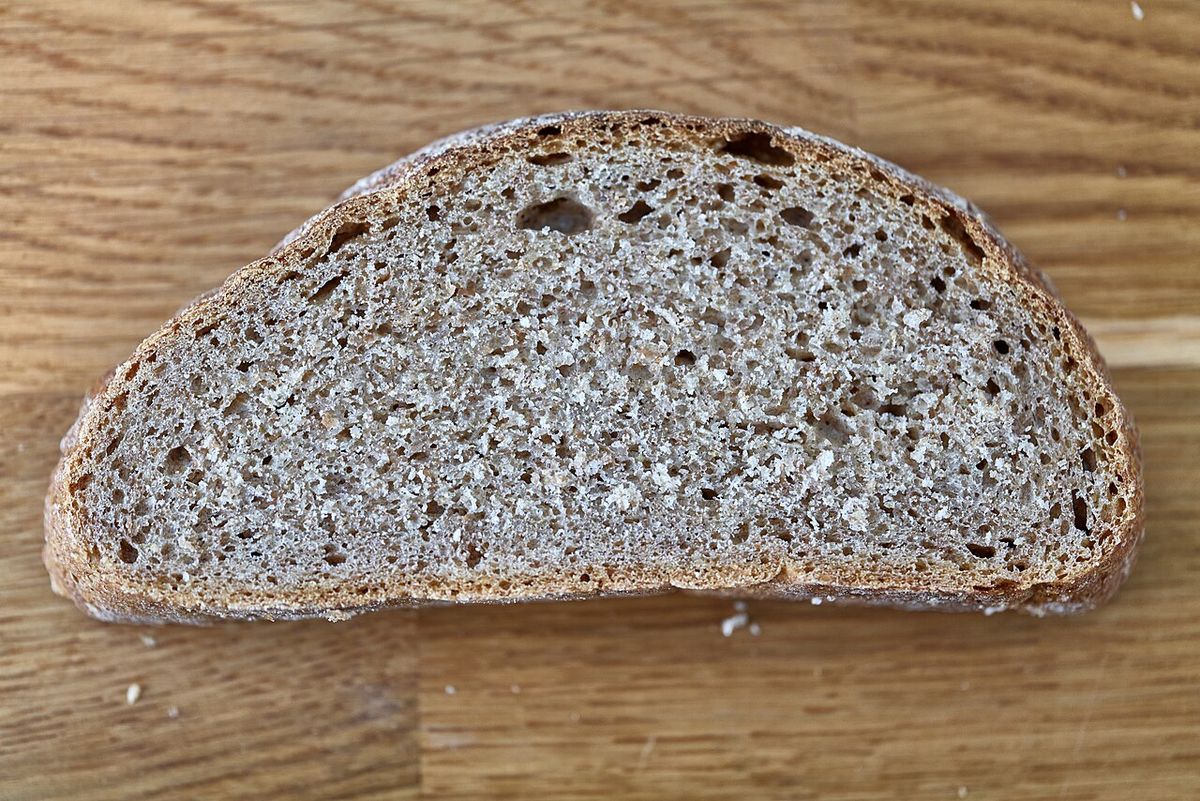
- Slice of rye bread Roggenbengel 2025-02-14 01Wikimedia Commons · Image, CC0, photo by Leonhard Lenz
General information, not medical advice. This study shows associations measured at one point in time, not cause and effect, and it cannot say that changing your diet will change your waist or weight. Talk to your doctor or a qualified dietitian before making major changes to what you eat, especially if you have a medical condition.
Analysis by NutroPractic from the sources listed. Written for general readers; it does not replace advice from your own doctor.
From our articles
Read, then eat a little better
Plain-language guides on nutrition and wellness, backed by research.
Global data
Diabetes, obesity, child malnutrition and hunger, 1980 to 2050: what the numbers show
How diabetes, obesity, child malnutrition and hunger have changed since 1980, with sourced figures and a basic projection to 2050. Click a condition to explore the chart and its facts.
5 Oct 2026
Indian kitchen
Rice, roti and blood sugar: building a balanced Indian plate with the ICMR-NIN 2024 guidelines
About one in nine Indian adults has diabetes and many more have prediabetes. You don't have to give up rice or roti. How the ICMR-NIN Dietary Guidelines for Indians (2024) suggest building a plate, plus simple habits that help keep blood sugar steady.
3 Oct 2026

Micronutrients
Vitamin D and B12: two common gaps, from northern winters to vegetarian kitchens
Vitamin D runs low in Canadian and European winters, and surprisingly often in sunny India too. Vitamin B12 is a risk for vegetarians, people over 50 and people on certain medicines. Who is at risk, what the official advice is in North America, Europe and India, and where to get both.
3 Oct 2026
Newsfeed for your website
Want this feed on your website?
Add it to any site with one copy-and-paste snippet. No sign-up, and it updates itself every hour.
Start with a virtual consultation
Tell Dr. Triveni what you want to change. You will leave with a clear next step, whether you are in Toronto, London, New York or Chennai.