Teen nutrition · October 13, 2026
Sixty-one Chilean schoolchildren had a brain scan and filled in a food questionnaire. The frequent pastry eaters had a smaller memory centre, and fruit and vegetables showed no link either way
Researchers in Valparaíso scanned the brains of 61 children aged about eleven and asked how often they ate nine kinds of food. Pastries, fried food and soft drinks tracked together with smaller volumes in parts of the brain tied to memory, emotion and self-control. The healthy foods tracked with nothing. Before anyone clears out the bread bin, it is worth seeing how small this study is and how much it cannot say.
The paper has the kind of title that travels: 'The weight of junk food'. It was published on 11 October 2026 in Applied Psychology: Health and Well-Being, and it reports that Chilean schoolchildren who ate more pastries, fried food and soft drinks had smaller volumes in a handful of brain regions. That is what the data show. What they mean is a harder question, and the authors themselves call the work exploratory more than once.
The children came from the Cogni-Action Project, a study of 1,296 pupils aged 10 to 14 in fifth to eighth grade, run from the Pontificia Universidad Católica de Valparaíso between 2017 and 2019. Brain scans are expensive, so only a small group whose families volunteered had one. After removing children without a usable image, three whose scans were blurred by movement or had other quality problems, and one in whom the scan turned up a tumour nobody had known about, 61 were left, from ten schools. Their average age was 11.6 and 26 of them were girls. All were right-handed and none had a diagnosed psychiatric or neurological condition, because both can change how a brain looks on a scan.
Each child had a structural MRI lasting about four and a half minutes. From it the team measured total grey matter, the hippocampus (which the brain leans on for forming memories), the amygdala (involved in emotion), and a set of areas at the front of the brain that handle planning and self-control.
Diet was measured with a short Chilean questionnaire that asks how often a child eats nine kinds of food: fruit, vegetables, dairy, legumes and fish on the healthy side, and soft drinks, pastries, fried foods and added table sugar on the other. The researchers then split each food into two groups, children who had it up to three times a week and children who had it four times a week or more. By that cut, 74% were frequent eaters of fried food, 69% of soft drinks and 57% of pastries. A quarter ate fruit that often and one in six ate vegetables that often. On the questionnaire's overall score not a single child had a diet rated healthy. Eighty-seven per cent were rated unhealthy and the rest 'in need of changes'.
Then came the comparisons. Taking one food and one brain region at a time, and correcting for the number of tests run, exactly one link held up: children who ate pastries four or more times a week had a smaller hippocampus. Nothing else did, healthy or unhealthy.
The second analysis is the one behind the headline. Instead of testing foods one by one, it asks whether a blend of foods moves together with a blend of brain regions. For the four unhealthy foods it found one such pattern, and a fairly strong one (a correlation of 0.70): more pastries, fried food and soft drinks went with smaller hippocampus, amygdala and three of the frontal areas. Table sugar added almost nothing to the pattern. For the five healthy foods there was no pattern at all.
The authors read that lopsided result as a sign that, at this age, the harm from unhealthy food may outweigh any structural benefit from healthy food. That is one reading. Another is simpler. When no child in the sample eats well and only ten eat vegetables most days, there is very little difference between children on the healthy side for a statistical method to find.
Everything else about the design asks for the same caution. The children were scanned once and asked about food once, so nobody knows which came first. The authors point out that the frontal areas involved are the ones that help a person resist impulses, and it is at least as plausible that a child with less of that braking power reaches for the pastry as that the pastry shrank anything. The questionnaire records how often, not how much, and total calories were never measured. Body weight and fitness were collected but left out of the final adjustments, in a group whose average weight-for-age sat above the World Health Organization's line for overweight. Sixty-one children is a small number for a method that weighs four foods against ten brain regions at once. And these were families who agreed to a scan, in one part of Chile.
There is also a quieter point about what 'smaller' means. The paper does not say how much smaller in cubic millimetres, and the children were not given memory or attention tests for this analysis. An eleven-year-old's brain is in the middle of being trimmed and rewired, a process in which some regions are supposed to lose volume. A slightly smaller structure on one scan is not a diagnosis of anything.
So what is left? A first look, from a part of the world that brain-imaging research mostly ignores, suggesting that the kinds of food Chile's warning-label law is aimed at may be worth studying for what they do above the neck as well as around the waist. The team says the next step is to follow children over time with repeated scans and repeated diet records. Until that exists, this is a reason to ask the question, not an answer to it.
Cross-sectional brain-imaging analysis within the Cogni-Action Project, Valparaíso, Chile: 61 schoolchildren (mean age 11.6), structural MRI and a nine-item food frequency questionnaire, data collected 2017 to 2019
61
Children with a usable brain scan, from 10 schools, out of 1,296 in the full project. Mean age 11.6, 26 of them girls
0%
Had a diet rated healthy on the questionnaire's overall score. 86.9% were rated unhealthy and 13.1% in need of changes
57%
Ate pastries four or more times a week (35 children). For soft drinks it was 69% and for fried foods 74%
1 link
Survived correction when foods were tested one at a time: frequent pastry eating and a smaller hippocampus (standardised beta -0.40, 95% CI -0.57 to -0.23)
r = -0.70
Correlation between the combined unhealthy-food pattern and the combined brain-volume pattern (permutation p = 0.008)
0 of 5
Healthy-food patterns that reached significance. Fruit, vegetables, dairy, legumes and fish showed no link with brain volume
Figures are from the full open-access paper (doi 10.1111/aphw.70226, published online 11 October 2026), read in PubMed Central. 'Frequent' means four or more times a week, the cut the authors used for every food. Analyses were adjusted for sex, physical maturity, a school-level index of social vulnerability, skull volume and the child's overall diet score; body mass index and fitness were measured but dropped from the final models. In the combined analysis the foods that carried the pattern were pastries, fried foods and soft drinks (cross-loadings 0.38 to 0.62), and the brain regions were the hippocampus, amygdala, caudal anterior cingulate, pars opercularis and pars triangularis (-0.43 to -0.15). The paper gives no volumes in cubic millimetres for the differences. One detail the paper leaves unexplained: its table lists 79% of the children as frequent fish eaters and 69% as frequent legume eaters, which sits oddly beside a 0% healthy-diet rating. The questionnaire does not measure portion size, energy intake or how processed a food is, so 'junk food' and 'ultra-processed' are the authors' framing and not something it recorded. Funding came from Chilean government research agencies (CONICYT/FONDECYT and ANID). The authors declare no conflicts of interest.
- Chile's food labelling and advertising law, Law 20.606, puts warning labels on packaged foods high in sugar, saturated fat, salt or calories. The authors frame their study partly as a test of whether such policies could matter for the brain as well as for weight.
- The paper notes that Chile has some of the highest rates of childhood and adolescent obesity in the world.
- An earlier Dutch study the authors cite followed children from infancy: those who ate more snacks, processed foods and sugar at ages 1 and 8 had a smaller overall brain volume at age 10.
- Only right-handed children were scanned. Left-handed and right-handed brains are organised slightly differently, enough to muddy a study this small.
- Most brain-imaging research on diet comes from high-income countries. The authors say they know of no earlier MRI study of food groups and multiple brain regions in a South American developing country.
- The weight of junk food: Smaller hippocampal, amygdala, and prefrontal volumes in adolescents. The Cogni-Action ProjectApplied Psychology: Health and Well-Being, 18(5), e70226, published online 11 October 2026 (open access) · The new paper: who was scanned, the food questionnaire, both analyses, limitations, funding
- Full text in PubMed Central (PMC13655188)US National Library of Medicine · Free full text, read in full for this item
- Study protocol and rationale of the 'Cogni-action project'BMC Pediatrics, 2019 (open access) · The design of the parent study of Chilean schoolchildren that these 61 came from
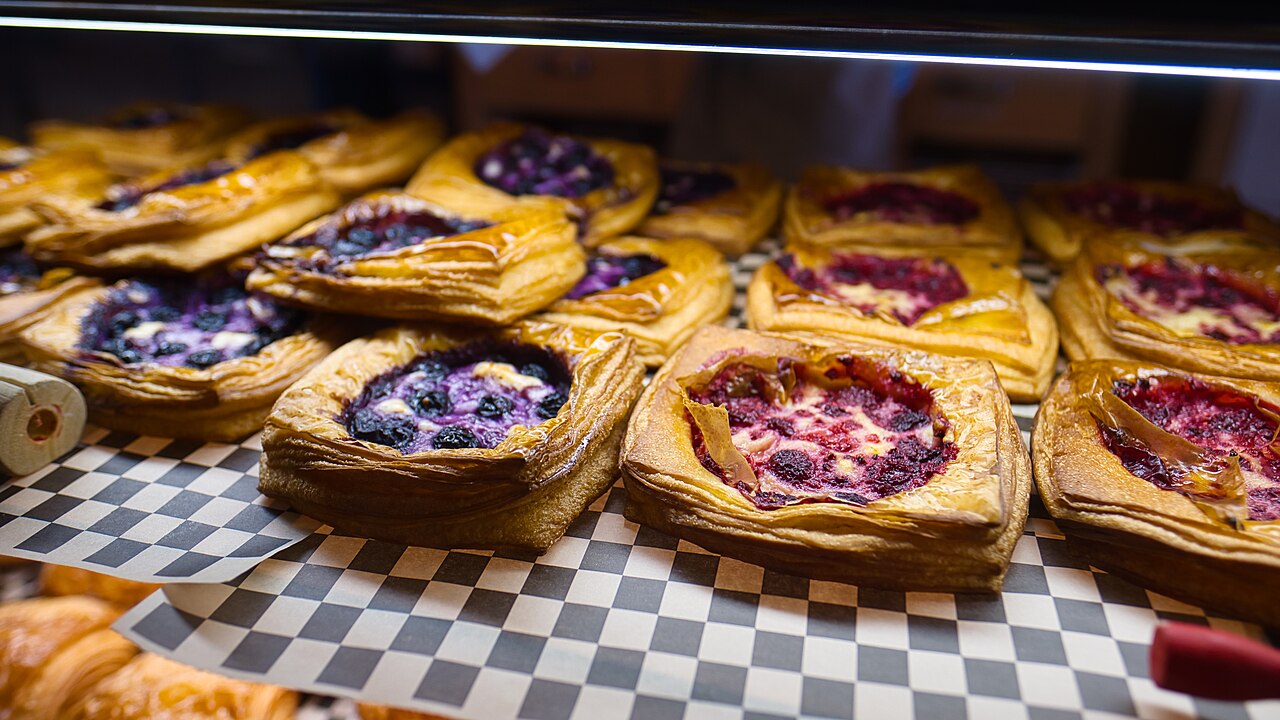
- Pastries on displayWikimedia Commons · Image, CC BY 2.0, Chris Rycroft
General information, not medical advice. This was a small study that looked at children once; it shows a link between how often some foods were eaten and the size of some brain regions, not that the foods caused the difference or that any child was harmed. If you have concerns about a child's eating, growth or development, talk to their doctor or a registered dietitian.
Analysis by NutroPractic from the sources listed. Written for general readers; it does not replace advice from your own doctor.
From our articles
Read, then eat a little better
Plain-language guides on nutrition and wellness, backed by research.
Global data
Diabetes, obesity, child malnutrition and hunger, 1980 to 2050: what the numbers show
How diabetes, obesity, child malnutrition and hunger have changed since 1980, with sourced figures and a basic projection to 2050. Click a condition to explore the chart and its facts.
5 Oct 2026
Indian kitchen
Rice, roti and blood sugar: building a balanced Indian plate with the ICMR-NIN 2024 guidelines
About one in nine Indian adults has diabetes and many more have prediabetes. You don't have to give up rice or roti. How the ICMR-NIN Dietary Guidelines for Indians (2024) suggest building a plate, plus simple habits that help keep blood sugar steady.
3 Oct 2026

Micronutrients
Vitamin D and B12: two common gaps, from northern winters to vegetarian kitchens
Vitamin D runs low in Canadian and European winters, and surprisingly often in sunny India too. Vitamin B12 is a risk for vegetarians, people over 50 and people on certain medicines. Who is at risk, what the official advice is in North America, Europe and India, and where to get both.
3 Oct 2026
Newsfeed for your website
Want this feed on your website?
Add it to any site with one copy-and-paste snippet. No sign-up, and it updates itself every hour.
Start with a virtual consultation
Tell Dr. Triveni what you want to change. You will leave with a clear next step, whether you are in Toronto, London, New York or Chennai.