Blood pressure · November 7, 2026
Protein, fat or carbohydrate share did not predict hypertension in 14,384 Chinese adults. Even the model's six-year forecasts barely improved when diet was added
More than a third developed high blood pressure, yet swapping five percentage points between macronutrients crossed the null. Broad nutrient shares may be too blunt to capture food quality.
China's diet changed markedly between the early 1990s and 2010s, while high blood pressure became more common. Researchers tested whether the percentage of energy from protein, fat and carbohydrate could explain who developed hypertension in the China Health and Nutrition Survey.
They followed 14,384 adults who did not have hypertension at baseline. Diet was recorded with three consecutive 24-hour recalls plus household food inventories. During follow-up, 5,234 people — 36.4% — met the study's hypertension outcome.
In the main adjusted analysis, neither of the simple substitutions was clear. Replacing five percentage points of carbohydrate with protein gave a hazard ratio of 0.986, with a confidence interval from 0.920 to 1.056. Replacing carbohydrate with fat also gave 0.986, with a tighter interval from 0.968 to 1.004. Both intervals include no association.
The number of macronutrients falling inside Chinese recommended ranges also did not predict risk, and adding dietary features did not materially improve prediction among 9,284 verified six-year outcomes. This does not mean food is irrelevant to blood pressure. Macronutrient percentage cannot distinguish whole grains from refined grains, fish from processed meat, or unsaturated from saturated fat, and sodium was not the question being tested. The result is a warning against treating three broad percentages as a complete diet.
Large cohort, little signal from broad nutrient shares
14,384
Adults without hypertension at baseline in the full cohort
5,234
People who developed the study's hypertension outcome, or 36.4%
0.986
Hazard ratio per 5-point protein-for-carbohydrate substitution; 95% CI 0.920–1.056
0.986
Hazard ratio per 5-point fat-for-carbohydrate substitution; 95% CI 0.968–1.004
9,284
Verified six-year endpoints used for temporal prediction testing
1.37 to 1.53
Standardised count of macronutrients inside recommended ranges, 1991 to 2011
Observational cohort with repeated survey infrastructure. Substitution estimates concern percentage points of reported energy, not particular foods, and confidence intervals crossed the null. Null findings for broad shares do not rule out effects of sodium, food quality or dietary patterns.
- If protein, fat and carbohydrate make up the whole energy pie, increasing one share necessarily reduces at least one other share.
- Three consecutive recalls give more information than one day, but may still miss a person's long-term usual diet.
- Hypertension can be influenced by sodium, potassium, alcohol, body weight, activity, sleep, medicines and genetics as well as overall diet.
- A predictive model can find an association yet add little practical forecasting value, and the reverse is also possible.
- Macronutrient composition and incident hypertension during China's nutrition transition: a longitudinal cohort analysis of the China Health and Nutrition SurveyFrontiers in Nutrition, 4 November 2026 · Primary open-access study; cohort, dietary method, events, substitution models and prediction analysis checked against the full article.
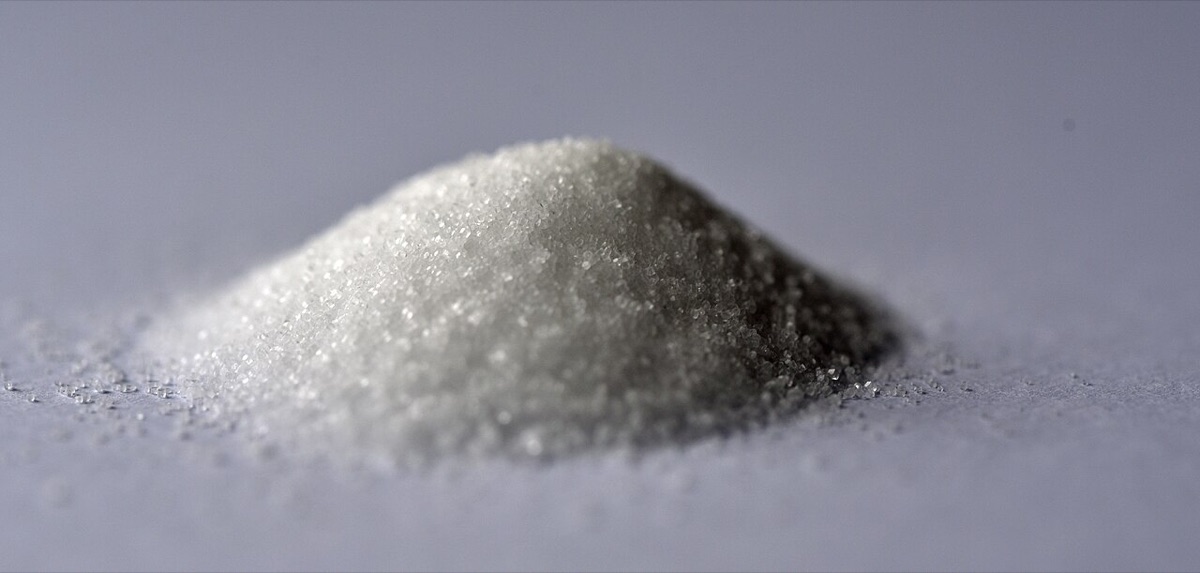
- Table saltWikimedia Commons · Photograph by Conall, CC BY 2.0; general blood-pressure illustration only.
General information, not medical advice. This study does not show that macronutrient balance is unimportant or prescribe a ratio. People with high blood pressure should follow individual advice from a qualified clinician or registered dietitian.
Analysis by NutroPractic from the sources listed. Written for general readers; it does not replace advice from your own doctor.
From our articles
Our guides on this subject
Plain-language guides on nutrition and wellness, backed by research.
Everyday eating
Protein bars and shakes: what you get per 100 calories
Four current labels range from 6.3 to 20 g protein per 100 kcal. Here is how bars, shakes, eggs, yogurt and lentils compare—and when a supplement actually helps.
6 Nov 2026

Everyday eating
Instant noodles: the sodium in the whole packet, and what actually reduces it
Three official labels range from 750 to 1,520 mg sodium per packet. Here is the whole-pack arithmetic, what the broth study measured, and how to turn noodles into a more complete meal.
6 Nov 2026
Everyday eating
Food label claims decoded: 'no added sugar', 'multigrain', 'natural' and 'high protein'
A no-added-sugar biscuit with only 13% fewer calories. A 7-grain loaf with refined flour listed first. A 'high protein' bar that clears the legal line at 21%. What each claim legally requires in the EU/UK, US and India, with worked reads of real packs.
2 Nov 2026
Newsfeed for your website
Want this feed on your website?
Add it to any site with one copy-and-paste snippet. No sign-up, and it updates itself every hour.
Start with a virtual consultation
Tell Dr. Triveni what you want to change. You will leave with a clear next step, whether you are in Toronto, London, New York or Chennai.